

US Pending Home Sales Index (I:USPHSI)
Level Chart
Basic Info
|
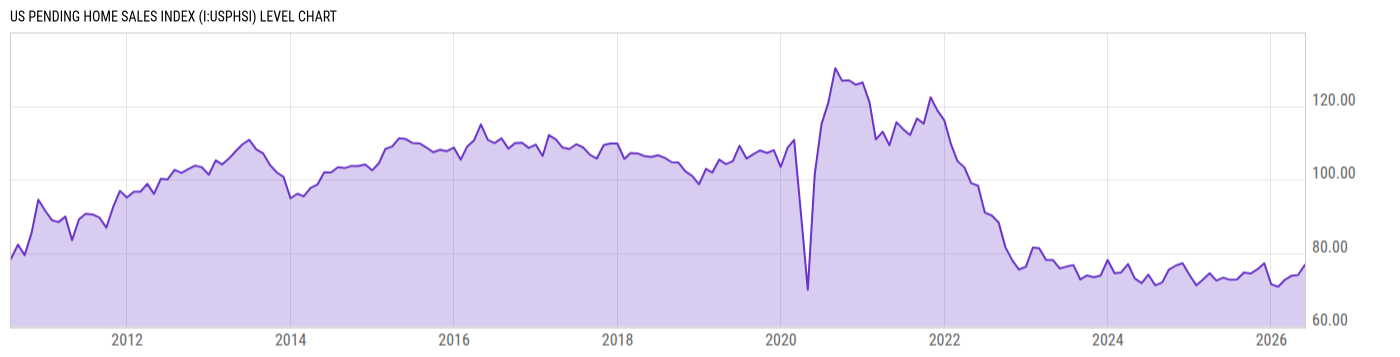
US Pending Home Sales Index is at a current level of 76.80, up from 74.00 last month and up from 73.30 one year ago. This is a change of 3.78% from last month and 4.77% from one year ago. |
|
US Pending Home Sales Index tracks the transactions of home sale contracts not yet completed in the US, where an index of 100 was considered average contract activity in 2001. Since pending home sales would tend to become existing home sales in a few months, the pending home sales index can be used as a leading indicator for housing market activity in the US. Historically, the US Pending Home Sales Index troughed in the aftermath of the US Housing Crisis. |
| Report | Pending Home Sales Index |
| Category | House Sales |
| Region | United States |
| Source | National Association of Realtors |
Stats
| Last Value | 76.80 |
| Latest Period | May 2026 |
| Last Updated | Jun 17 2026, 15:59 EDT |
| Next Release | Jul 16 2026, 10:00 EDT |
| Average Growth Rate | 1.28% |
| Value from Last Month | 74.00 |
| Change from Last Month | 3.78% |
| Value from 1 Year Ago | 73.30 |
| Change from 1 Year Ago | 4.77% |
| Frequency | Monthly |
| Adjustment | Seasonally Adjusted |
| Download Source File |
Historical Data
| Date | Value |
|---|---|
| May 31, 2026 | 76.80 |
| April 30, 2026 | 74.00 |
| March 31, 2026 | 73.80 |
| February 28, 2026 | 72.60 |
| January 31, 2026 | 70.80 |
| December 31, 2025 | 71.50 |
| November 30, 2025 | 77.20 |
| October 31, 2025 | 75.60 |
| September 30, 2025 | 74.40 |
| August 31, 2025 | 74.70 |
| July 31, 2025 | 72.80 |
| June 30, 2025 | 72.70 |
| May 31, 2025 | 73.30 |
| April 30, 2025 | 72.50 |
| March 31, 2025 | 74.50 |
| February 28, 2025 | 72.70 |
| January 31, 2025 | 71.20 |
| December 31, 2024 | 74.00 |
| November 30, 2024 | 77.20 |
| October 31, 2024 | 76.60 |
| September 30, 2024 | 75.50 |
| August 31, 2024 | 72.00 |
| July 31, 2024 | 71.20 |
| June 30, 2024 | 74.10 |
| May 31, 2024 | 71.80 |
| Date | Value |
|---|---|
| April 30, 2024 | 73.10 |
| March 31, 2024 | 77.00 |
| February 29, 2024 | 74.70 |
| January 31, 2024 | 74.50 |
| December 31, 2023 | 78.10 |
| November 30, 2023 | 73.90 |
| October 31, 2023 | 73.40 |
| September 30, 2023 | 73.90 |
| August 31, 2023 | 72.80 |
| July 31, 2023 | 76.70 |
| June 30, 2023 | 76.30 |
| May 31, 2023 | 75.80 |
| April 30, 2023 | 78.10 |
| March 31, 2023 | 78.10 |
| February 28, 2023 | 81.30 |
| January 31, 2023 | 81.50 |
| December 31, 2022 | 76.30 |
| November 30, 2022 | 75.50 |
| October 31, 2022 | 78.00 |
| September 30, 2022 | 81.60 |
| August 31, 2022 | 88.30 |
| July 31, 2022 | 90.20 |
| June 30, 2022 | 91.00 |
| May 31, 2022 | 98.30 |
| April 30, 2022 | 99.00 |
News
Basic Info
|
US Pending Home Sales Index is at a current level of 76.80, up from 74.00 last month and up from 73.30 one year ago. This is a change of 3.78% from last month and 4.77% from one year ago. |
|
US Pending Home Sales Index tracks the transactions of home sale contracts not yet completed in the US, where an index of 100 was considered average contract activity in 2001. Since pending home sales would tend to become existing home sales in a few months, the pending home sales index can be used as a leading indicator for housing market activity in the US. Historically, the US Pending Home Sales Index troughed in the aftermath of the US Housing Crisis. |
| Report | Pending Home Sales Index |
| Category | House Sales |
| Region | United States |
| Source | National Association of Realtors |
Stats
| Last Value | 76.80 |
| Latest Period | May 2026 |
| Last Updated | Jun 17 2026, 15:59 EDT |
| Next Release | Jul 16 2026, 10:00 EDT |
| Average Growth Rate | 1.28% |
| Value from Last Month | 74.00 |
| Change from Last Month | 3.78% |
| Value from 1 Year Ago | 73.30 |
| Change from 1 Year Ago | 4.77% |
| Frequency | Monthly |
| Adjustment | Seasonally Adjusted |
| Download Source File |
Related Indicators
| US Housing |
| 15 Year Mortgage Rate | 5.82% |
| 30 Year Mortgage Rate | 6.49% |
| US Building Permits MoM | -0.70% |
| US Existing Home Sales MoM | -2.39% |
| US Home Ownership Rate | 65.30% |
| US Home Vacancy Rate | 1.10% |
| US Housing Starts MoM | -15.45% |
| US New Single Family Houses Sold | 580.00K |
| US New Single Family Houses Sold MoM | -7.35% |
| US Pending Home Sales MoM | 3.78% |
| US Pending Home Sales YoY | 4.77% |
| US Rental Vacancy Rate | 7.30% |