

US Natural Gas Consumption (I:USNGZ16G)
3.921Q Btu for Jan 2026
Level Chart
Basic Info
|
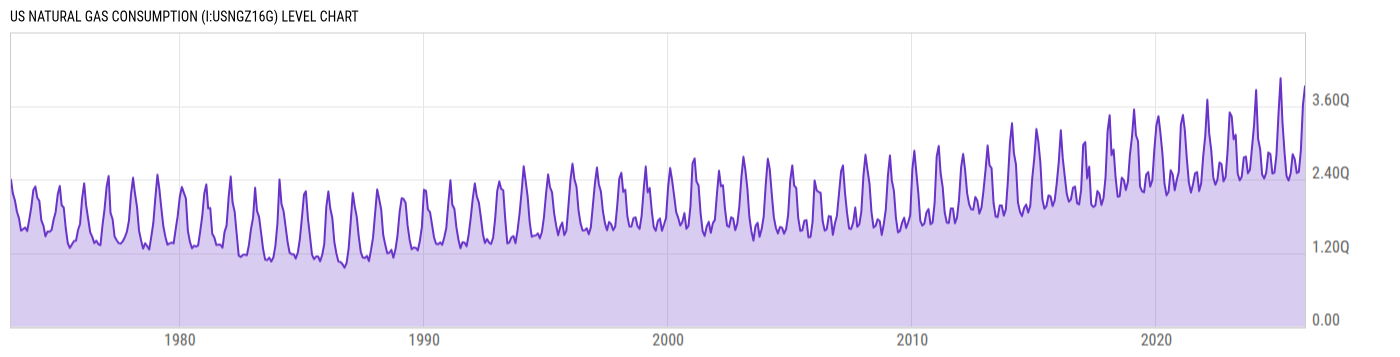
US Natural Gas Consumption is at a current level of 3.921Q, up from 3.614Q last month and down from 4.052Q one year ago. This is a change of 8.48% from last month and -3.23% from one year ago. |
| Report | Monthly Energy Review |
| Category | Energy |
| Region | United States |
| Source | Energy Information Administration |
Stats
| Last Value | 3.921Q |
| Latest Period | Jan 2026 |
| Last Updated | Apr 27 2026, 18:16 EDT |
| Next Release | May 26 2026, 14:00 EDT |
| Average Growth Rate | 11.18% |
| Value from Last Month | 3.614Q |
| Change from Last Month | 8.48% |
| Value from 1 Year Ago | 4.052Q |
| Change from 1 Year Ago | -3.23% |
| Frequency | Monthly |
| Unit | British thermal units |
| Adjustment | N/A |
| Download Source File | |
| Notes | Excluding supplemental gasseous fuels |
Historical Data
| Date | Value |
|---|---|
| January 31, 2026 | 3.921Q |
| December 31, 2025 | 3.614Q |
| November 30, 2025 | 2.875Q |
| October 31, 2025 | 2.524Q |
| September 30, 2025 | 2.506Q |
| August 31, 2025 | 2.73Q |
| July 31, 2025 | 2.814Q |
| June 30, 2025 | 2.497Q |
| May 31, 2025 | 2.384Q |
| April 30, 2025 | 2.455Q |
| March 31, 2025 | 2.841Q |
| February 28, 2025 | 3.340Q |
| January 31, 2025 | 4.052Q |
| December 31, 2024 | 3.478Q |
| November 30, 2024 | 2.802Q |
| October 31, 2024 | 2.512Q |
| September 30, 2024 | 2.498Q |
| August 31, 2024 | 2.816Q |
| July 31, 2024 | 2.840Q |
| June 30, 2024 | 2.513Q |
| May 31, 2024 | 2.417Q |
| April 30, 2024 | 2.480Q |
| March 31, 2024 | 2.896Q |
| February 29, 2024 | 3.069Q |
| January 31, 2024 | 3.860Q |
| Date | Value |
|---|---|
| December 31, 2023 | 3.289Q |
| November 30, 2023 | 2.920Q |
| October 31, 2023 | 2.560Q |
| September 30, 2023 | 2.501Q |
| August 31, 2023 | 2.774Q |
| July 31, 2023 | 2.762Q |
| June 30, 2023 | 2.446Q |
| May 31, 2023 | 2.386Q |
| April 30, 2023 | 2.499Q |
| March 31, 2023 | 3.129Q |
| February 28, 2023 | 3.057Q |
| January 31, 2023 | 3.428Q |
| December 31, 2022 | 3.494Q |
| November 30, 2022 | 2.862Q |
| October 31, 2022 | 2.441Q |
| September 30, 2022 | 2.370Q |
| August 31, 2022 | 2.652Q |
| July 31, 2022 | 2.677Q |
| June 30, 2022 | 2.393Q |
| May 31, 2022 | 2.313Q |
| April 30, 2022 | 2.434Q |
| March 31, 2022 | 2.872Q |
| February 28, 2022 | 3.153Q |
| January 31, 2022 | 3.704Q |
| December 31, 2021 | 3.113Q |
News
Headline
Time (ET)
05/22 15:56
05/12 15:59
Basic Info
|
US Natural Gas Consumption is at a current level of 3.921Q, up from 3.614Q last month and down from 4.052Q one year ago. This is a change of 8.48% from last month and -3.23% from one year ago. |
| Report | Monthly Energy Review |
| Category | Energy |
| Region | United States |
| Source | Energy Information Administration |
Stats
| Last Value | 3.921Q |
| Latest Period | Jan 2026 |
| Last Updated | Apr 27 2026, 18:16 EDT |
| Next Release | May 26 2026, 14:00 EDT |
| Average Growth Rate | 11.18% |
| Value from Last Month | 3.614Q |
| Change from Last Month | 8.48% |
| Value from 1 Year Ago | 4.052Q |
| Change from 1 Year Ago | -3.23% |
| Frequency | Monthly |
| Unit | British thermal units |
| Adjustment | N/A |
| Download Source File | |
| Notes | Excluding supplemental gasseous fuels |