

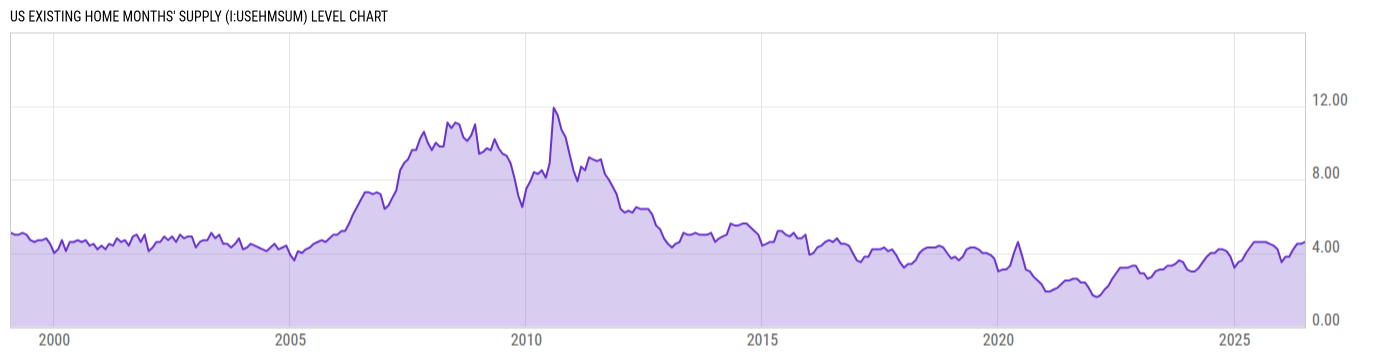
US Existing Home Months' Supply (I:USEHMSUM)
4.60 for Jun 2026
Level Chart
Basic Info
|
US Existing Home Months' Supply is at a current level of 4.60, up from 4.50 last month and unchanged from 4.60 one year ago. This is a change of 2.22% from last month. |
| Report | Existing-Home Sales |
| Category | House Sales |
| Region | United States |
| Source | National Association of Realtors |
Stats
| Last Value | 4.60 |
| Latest Period | Jun 2026 |
| Last Updated | Jul 10 2026, 11:05 EDT |
| Next Release | Aug 11 2026, 10:00 EDT |
| Average Growth Rate | 2.67% |
| Value from Last Month | 4.50 |
| Change from Last Month | 2.22% |
| Value from 1 Year Ago | 4.60 |
| Change from 1 Year Ago | 0.00% |
| Frequency | Monthly |
| Adjustment | Not Seasonally Adjusted |
| Download Source File | |
| Notes | Measured in months. |
Historical Data
| Date | Value |
|---|---|
| June 30, 2026 | 4.60 |
| May 31, 2026 | 4.50 |
| April 30, 2026 | 4.50 |
| March 31, 2026 | 4.20 |
| February 28, 2026 | 3.80 |
| January 31, 2026 | 3.80 |
| December 31, 2025 | 3.50 |
| November 30, 2025 | 4.20 |
| October 31, 2025 | 4.40 |
| September 30, 2025 | 4.50 |
| August 31, 2025 | 4.60 |
| July 31, 2025 | 4.60 |
| June 30, 2025 | 4.60 |
| May 31, 2025 | 4.60 |
| April 30, 2025 | 4.30 |
| March 31, 2025 | 4.00 |
| February 28, 2025 | 3.60 |
| January 31, 2025 | 3.50 |
| December 31, 2024 | 3.20 |
| November 30, 2024 | 3.80 |
| October 31, 2024 | 4.10 |
| September 30, 2024 | 4.20 |
| August 31, 2024 | 4.20 |
| July 31, 2024 | 4.00 |
| June 30, 2024 | 4.00 |
| Date | Value |
|---|---|
| May 31, 2024 | 3.80 |
| April 30, 2024 | 3.50 |
| March 31, 2024 | 3.20 |
| February 29, 2024 | 3.00 |
| January 31, 2024 | 3.00 |
| December 31, 2023 | 3.10 |
| November 30, 2023 | 3.50 |
| October 31, 2023 | 3.60 |
| September 30, 2023 | 3.40 |
| August 31, 2023 | 3.30 |
| July 31, 2023 | 3.30 |
| June 30, 2023 | 3.10 |
| May 31, 2023 | 3.10 |
| April 30, 2023 | 3.00 |
| March 31, 2023 | 2.70 |
| February 28, 2023 | 2.60 |
| January 31, 2023 | 2.90 |
| December 31, 2022 | 2.90 |
| November 30, 2022 | 3.30 |
| October 31, 2022 | 3.30 |
| September 30, 2022 | 3.20 |
| August 31, 2022 | 3.20 |
| July 31, 2022 | 3.20 |
| June 30, 2022 | 2.90 |
| May 31, 2022 | 2.60 |
News
Headline
Time (ET)
06/30 12:33
06/17 07:24
06/16 11:14
06/16 07:20
Basic Info
|
US Existing Home Months' Supply is at a current level of 4.60, up from 4.50 last month and unchanged from 4.60 one year ago. This is a change of 2.22% from last month. |
| Report | Existing-Home Sales |
| Category | House Sales |
| Region | United States |
| Source | National Association of Realtors |
Stats
| Last Value | 4.60 |
| Latest Period | Jun 2026 |
| Last Updated | Jul 10 2026, 11:05 EDT |
| Next Release | Aug 11 2026, 10:00 EDT |
| Average Growth Rate | 2.67% |
| Value from Last Month | 4.50 |
| Change from Last Month | 2.22% |
| Value from 1 Year Ago | 4.60 |
| Change from 1 Year Ago | 0.00% |
| Frequency | Monthly |
| Adjustment | Not Seasonally Adjusted |
| Download Source File | |
| Notes | Measured in months. |