

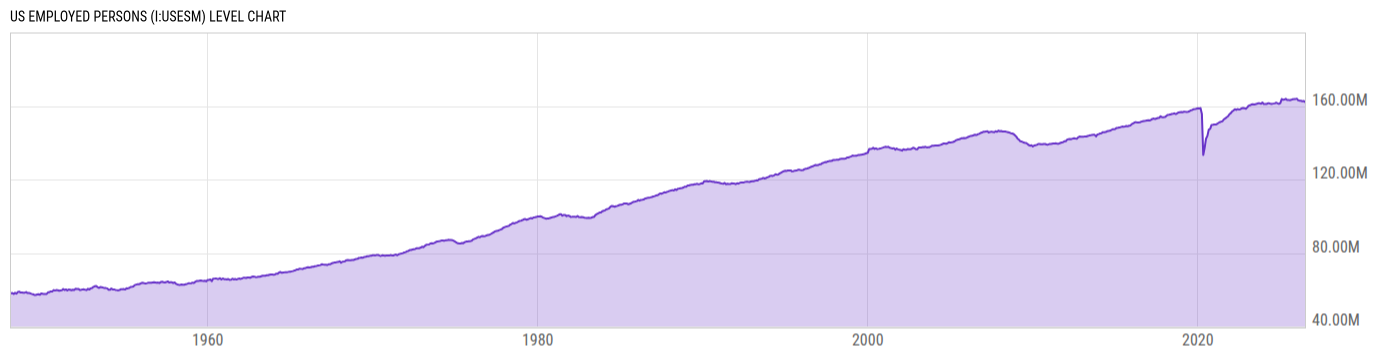
US Employed Persons (I:USESM)
162.26M for Jun 2026
Level Chart
Basic Info
|
US Employed Persons is at a current level of 162.26M, down from 162.77M last month and down from 163.33M one year ago. This is a change of -0.31% from last month and -0.65% from one year ago. |
| Report | Employment Situation |
| Categories | Employment , Hours and Wages |
| Region | United States |
| Source | Bureau of Labor Statistics |
Stats
| Last Value | 162.26M |
| Latest Period | Jun 2026 |
| Last Updated | Jul 2 2026, 08:43 EDT |
| Next Release | Aug 7 2026, 08:30 EDT |
| Average Growth Rate | 1.34% |
| Value from Last Month | 162.77M |
| Change from Last Month | -0.31% |
| Value from 1 Year Ago | 163.33M |
| Change from 1 Year Ago | -0.65% |
| Frequency | Monthly |
| Adjustment | Seasonally Adjusted |
| Download Source File |
Historical Data
| Date | Value |
|---|---|
| June 30, 2026 | 162.26M |
| May 31, 2026 | 162.77M |
| April 30, 2026 | 162.62M |
| March 31, 2026 | 162.85M |
| February 28, 2026 | 162.91M |
| January 31, 2026 | 163.10M |
| December 31, 2025 | 163.99M |
| November 30, 2025 | 163.76M |
| October 31, 2025 | |
| September 30, 2025 | 163.66M |
| August 31, 2025 | 163.37M |
| July 31, 2025 | 163.14M |
| June 30, 2025 | 163.33M |
| May 31, 2025 | 163.24M |
| April 30, 2025 | 163.90M |
| March 31, 2025 | 163.51M |
| February 28, 2025 | 163.34M |
| January 31, 2025 | 163.83M |
| December 31, 2024 | 161.59M |
| November 30, 2024 | 161.16M |
| October 31, 2024 | 161.44M |
| September 30, 2024 | 161.81M |
| August 31, 2024 | 161.43M |
| July 31, 2024 | 161.30M |
| June 30, 2024 | 161.15M |
| Date | Value |
|---|---|
| May 31, 2024 | 161.18M |
| April 30, 2024 | 161.44M |
| March 31, 2024 | 161.46M |
| February 29, 2024 | 161.08M |
| January 31, 2024 | 161.13M |
| December 31, 2023 | 161.06M |
| November 30, 2023 | 161.89M |
| October 31, 2023 | 161.21M |
| September 30, 2023 | 161.44M |
| August 31, 2023 | 161.48M |
| July 31, 2023 | 161.18M |
| June 30, 2023 | 160.98M |
| May 31, 2023 | 160.80M |
| April 30, 2023 | 160.97M |
| March 31, 2023 | 160.81M |
| February 28, 2023 | 160.40M |
| January 31, 2023 | 160.22M |
| December 31, 2022 | 159.26M |
| November 30, 2022 | 158.48M |
| October 31, 2022 | 158.73M |
| September 30, 2022 | 158.89M |
| August 31, 2022 | 158.76M |
| July 31, 2022 | 158.28M |
| June 30, 2022 | 158.12M |
| May 31, 2022 | 158.31M |
News
Headline
Time (ET)
07/13 09:06
07/10 08:58
07/02 16:13
Basic Info
|
US Employed Persons is at a current level of 162.26M, down from 162.77M last month and down from 163.33M one year ago. This is a change of -0.31% from last month and -0.65% from one year ago. |
| Report | Employment Situation |
| Categories | Employment , Hours and Wages |
| Region | United States |
| Source | Bureau of Labor Statistics |
Stats
| Last Value | 162.26M |
| Latest Period | Jun 2026 |
| Last Updated | Jul 2 2026, 08:43 EDT |
| Next Release | Aug 7 2026, 08:30 EDT |
| Average Growth Rate | 1.34% |
| Value from Last Month | 162.77M |
| Change from Last Month | -0.31% |
| Value from 1 Year Ago | 163.33M |
| Change from 1 Year Ago | -0.65% |
| Frequency | Monthly |
| Adjustment | Seasonally Adjusted |
| Download Source File |