

US Coal Consumption (I:USCCNM)
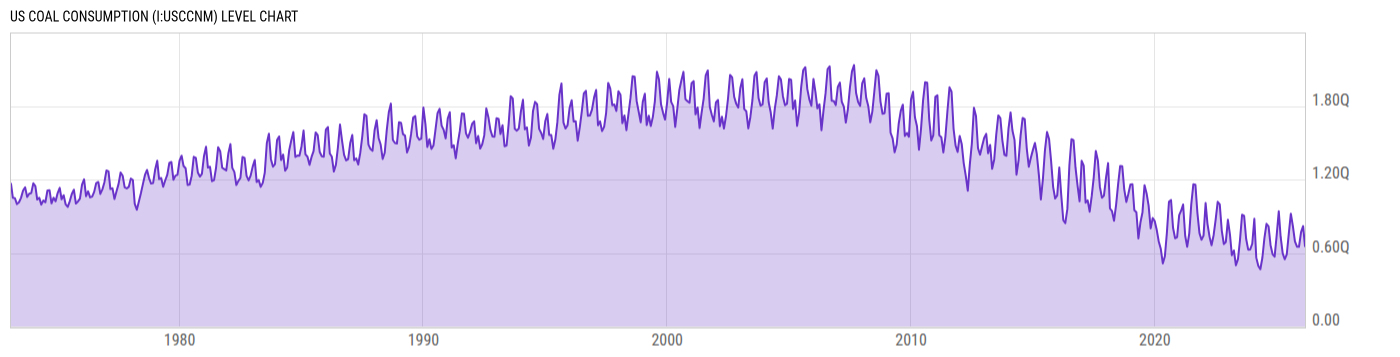
0.6550Q Btu for Feb 2026
Level Chart
Basic Info
|
US Coal Consumption is at a current level of 0.6550Q, down from 0.8192Q last month and down from 0.7329Q one year ago. This is a change of -20.05% from last month and -10.64% from one year ago. |
| Report | Monthly Energy Review |
| Category | Energy |
| Region | United States |
| Source | Energy Information Administration |
Stats
| Last Value | 0.6550Q |
| Latest Period | Feb 2026 |
| Last Updated | May 26 2026, 14:02 EDT |
| Next Release | Jun 25 2026, 14:00 EDT |
| Average Growth Rate | 5.19% |
| Value from Last Month | 0.8192Q |
| Change from Last Month | -20.05% |
| Value from 1 Year Ago | 0.7329Q |
| Change from 1 Year Ago | -10.64% |
| Frequency | Monthly |
| Unit | British thermal units |
| Adjustment | N/A |
| Download Source File |
Historical Data
| Date | Value |
|---|---|
| February 28, 2026 | 0.655Q |
| January 31, 2026 | 0.8192Q |
| December 31, 2025 | 0.7709Q |
| November 30, 2025 | 0.651Q |
| October 31, 2025 | 0.652Q |
| September 30, 2025 | 0.6951Q |
| August 31, 2025 | 0.8168Q |
| July 31, 2025 | 0.9208Q |
| June 30, 2025 | 0.7554Q |
| May 31, 2025 | 0.5896Q |
| April 30, 2025 | 0.5488Q |
| March 31, 2025 | 0.5971Q |
| February 28, 2025 | 0.7329Q |
| January 31, 2025 | 0.9403Q |
| December 31, 2024 | 0.7467Q |
| November 30, 2024 | 0.5699Q |
| October 31, 2024 | 0.5889Q |
| September 30, 2024 | 0.664Q |
| August 31, 2024 | 0.8178Q |
| July 31, 2024 | 0.8379Q |
| June 30, 2024 | 0.7214Q |
| May 31, 2024 | 0.5632Q |
| April 30, 2024 | 0.4674Q |
| March 31, 2024 | 0.4938Q |
| February 29, 2024 | 0.5622Q |
| Date | Value |
|---|---|
| January 31, 2024 | 0.879Q |
| December 31, 2023 | 0.6757Q |
| November 30, 2023 | 0.6291Q |
| October 31, 2023 | 0.6275Q |
| September 30, 2023 | 0.7162Q |
| August 31, 2023 | 0.9026Q |
| July 31, 2023 | 0.9124Q |
| June 30, 2023 | 0.7046Q |
| May 31, 2023 | 0.5504Q |
| April 30, 2023 | 0.50Q |
| March 31, 2023 | 0.6201Q |
| February 28, 2023 | 0.5821Q |
| January 31, 2023 | 0.7499Q |
| December 31, 2022 | 0.8706Q |
| November 30, 2022 | 0.6902Q |
| October 31, 2022 | 0.6734Q |
| September 30, 2022 | 0.7833Q |
| August 31, 2022 | 0.9967Q |
| July 31, 2022 | 1.018Q |
| June 30, 2022 | 0.8696Q |
| May 31, 2022 | 0.745Q |
| April 30, 2022 | 0.6627Q |
| March 31, 2022 | 0.733Q |
| February 28, 2022 | 0.838Q |
| January 31, 2022 | 1.008Q |
News
Headline
Time (ET)
06/09 07:58
05/22 15:56
05/12 15:59
Basic Info
|
US Coal Consumption is at a current level of 0.6550Q, down from 0.8192Q last month and down from 0.7329Q one year ago. This is a change of -20.05% from last month and -10.64% from one year ago. |
| Report | Monthly Energy Review |
| Category | Energy |
| Region | United States |
| Source | Energy Information Administration |
Stats
| Last Value | 0.6550Q |
| Latest Period | Feb 2026 |
| Last Updated | May 26 2026, 14:02 EDT |
| Next Release | Jun 25 2026, 14:00 EDT |
| Average Growth Rate | 5.19% |
| Value from Last Month | 0.8192Q |
| Change from Last Month | -20.05% |
| Value from 1 Year Ago | 0.7329Q |
| Change from 1 Year Ago | -10.64% |
| Frequency | Monthly |
| Unit | British thermal units |
| Adjustment | N/A |
| Download Source File |