

Tucson, AZ Payrolls: Trade, Transportation, and Utilities (I:TAZPTTU)
68.50K for Apr 2026
Level Chart
Basic Info
|
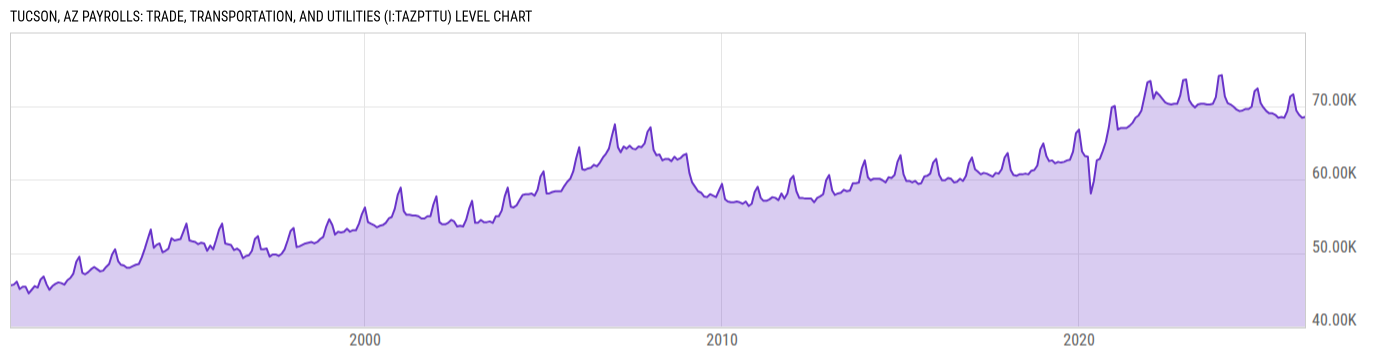
Tucson, AZ Payrolls: Trade, Transportation, and Utilities is at a current level of 68.50K, up from 68.40K last month and down from 69.00K one year ago. This is a change of 0.15% from last month and -0.72% from one year ago. |
| Report | Metropolitan Area Employment and Unemployment |
| Categories | Employment , Hours and Wages |
| Region | N/A |
| Source | Bureau of Labor Statistics |
Stats
| Last Value | 68.50K |
| Latest Period | Apr 2026 |
| Last Updated | May 22 2026, 19:20 EDT |
| Next Release | Jun 3 2026, 10:30 EDT |
| Average Growth Rate | 1.30% |
| Value from Last Month | 68.40K |
| Change from Last Month | 0.15% |
| Value from 1 Year Ago | 69.00K |
| Change from 1 Year Ago | -0.72% |
| Frequency | Monthly |
| Adjustment | Not Seasonally Adjusted |
| Download Source File |
Historical Data
| Date | Value |
|---|---|
| April 30, 2026 | 68.50K |
| March 31, 2026 | 68.40K |
| February 28, 2026 | 68.80K |
| January 31, 2026 | 69.40K |
| December 31, 2025 | 71.60K |
| November 30, 2025 | 71.30K |
| October 31, 2025 | 69.30K |
| September 30, 2025 | 68.40K |
| August 31, 2025 | 68.50K |
| July 31, 2025 | 68.40K |
| June 30, 2025 | 68.80K |
| May 31, 2025 | 69.00K |
| April 30, 2025 | 69.00K |
| March 31, 2025 | 69.30K |
| February 28, 2025 | 69.80K |
| January 31, 2025 | 70.40K |
| December 31, 2024 | 72.40K |
| November 30, 2024 | 72.00K |
| October 31, 2024 | 69.90K |
| September 30, 2024 | 69.60K |
| August 31, 2024 | 69.60K |
| July 31, 2024 | 69.40K |
| June 30, 2024 | 69.30K |
| May 31, 2024 | 69.50K |
| April 30, 2024 | 69.90K |
| Date | Value |
|---|---|
| March 31, 2024 | 70.20K |
| February 29, 2024 | 70.40K |
| January 31, 2024 | 71.30K |
| December 31, 2023 | 74.20K |
| November 30, 2023 | 74.10K |
| October 31, 2023 | 71.20K |
| September 30, 2023 | 70.30K |
| August 31, 2023 | 70.20K |
| July 31, 2023 | 70.20K |
| June 30, 2023 | 70.30K |
| May 31, 2023 | 70.30K |
| April 30, 2023 | 70.20K |
| March 31, 2023 | 69.80K |
| February 28, 2023 | 70.20K |
| January 31, 2023 | 70.80K |
| December 31, 2022 | 73.60K |
| November 30, 2022 | 73.50K |
| October 31, 2022 | 71.40K |
| September 30, 2022 | 70.30K |
| August 31, 2022 | 70.30K |
| July 31, 2022 | 70.20K |
| June 30, 2022 | 70.30K |
| May 31, 2022 | 70.50K |
| April 30, 2022 | 71.00K |
| March 31, 2022 | 71.50K |
News
Headline
Time (ET)
04/23 12:07
Basic Info
|
Tucson, AZ Payrolls: Trade, Transportation, and Utilities is at a current level of 68.50K, up from 68.40K last month and down from 69.00K one year ago. This is a change of 0.15% from last month and -0.72% from one year ago. |
| Report | Metropolitan Area Employment and Unemployment |
| Categories | Employment , Hours and Wages |
| Region | N/A |
| Source | Bureau of Labor Statistics |
Stats
| Last Value | 68.50K |
| Latest Period | Apr 2026 |
| Last Updated | May 22 2026, 19:20 EDT |
| Next Release | Jun 3 2026, 10:30 EDT |
| Average Growth Rate | 1.30% |
| Value from Last Month | 68.40K |
| Change from Last Month | 0.15% |
| Value from 1 Year Ago | 69.00K |
| Change from 1 Year Ago | -0.72% |
| Frequency | Monthly |
| Adjustment | Not Seasonally Adjusted |
| Download Source File |