

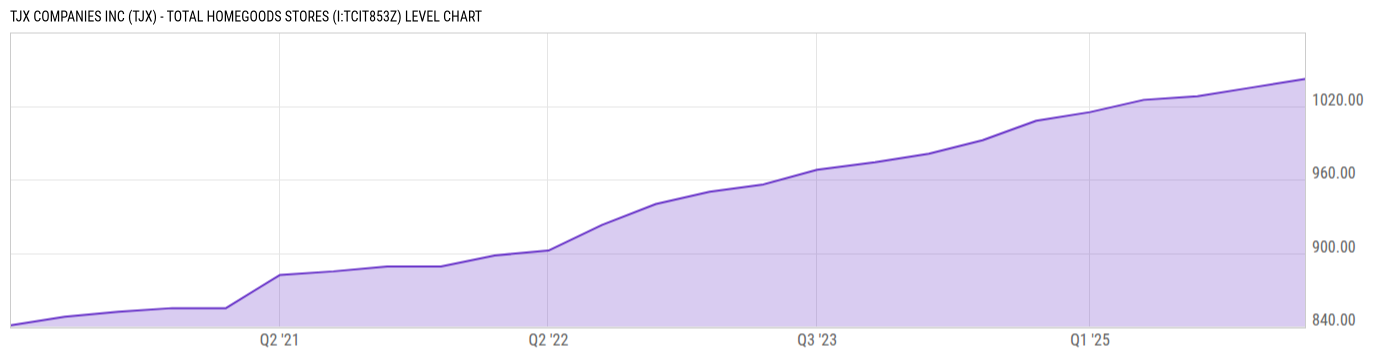
Tjx Companies Inc (TJX) - Total HomeGoods Stores (I:TCIT853Z)
1042.00 for Q1 2026
Level Chart
Basic Info
|
Tjx Companies Inc (TJX) - Total HomeGoods Stores is at a current level of 1042.00, up from 1035.00 last quarter and up from 1008.00 one year ago. This is a change of 0.68% from last quarter and 3.37% from one year ago. |
| Report | Fiscal.ai |
| Category | Segments & KPIs |
| Region | United States |
| Source | Fiscal.ai |
|
Data provided via Fiscal.ai |
Stats
| Last Value | 1042.00 |
| Latest Period | Jan 2026 |
| Last Updated | Mar 23 2026, 14:15 EDT |
| Next Release | Jul 15 2026, 08:30 EDT (E) |
| Average Growth Rate | 3.60% |
| Value from Last Quarter | 1035.00 |
| Change from Last Quarter | 0.68% |
| Value from 1 Year Ago | 1008.00 |
| Change from 1 Year Ago | 3.37% |
| Frequency | Quarterly |
| Adjustment | N/A |
| Download Source File |
Historical Data
| Date | Value |
|---|---|
| January 31, 2026 | 1042.00 |
| November 01, 2025 | 1035.00 |
| August 02, 2025 | 1028.00 |
| May 03, 2025 | 1025.00 |
| February 01, 2025 | 1015.00 |
| November 02, 2024 | 1008.00 |
| August 03, 2024 | 992.00 |
| May 04, 2024 | 981.00 |
| February 03, 2024 | 974.00 |
| October 28, 2023 | 968.00 |
| July 29, 2023 | 956.00 |
| April 29, 2023 | 950.00 |
| January 28, 2023 | 940.00 |
| Date | Value |
|---|---|
| October 29, 2022 | 923.00 |
| July 30, 2022 | 902.00 |
| April 30, 2022 | 898.00 |
| January 29, 2022 | 889.00 |
| October 30, 2021 | 889.00 |
| July 31, 2021 | 885.00 |
| May 01, 2021 | 882.00 |
| January 30, 2021 | 855.00 |
| October 31, 2020 | 855.00 |
| August 01, 2020 | 852.00 |
| May 02, 2020 | 848.00 |
| February 01, 2020 | 841.00 |
News
Headline
Time (ET)
05/22 14:40
05/11 16:10
05/08 08:40
Basic Info
|
Tjx Companies Inc (TJX) - Total HomeGoods Stores is at a current level of 1042.00, up from 1035.00 last quarter and up from 1008.00 one year ago. This is a change of 0.68% from last quarter and 3.37% from one year ago. |
| Report | Fiscal.ai |
| Category | Segments & KPIs |
| Region | United States |
| Source | Fiscal.ai |
|
Data provided via Fiscal.ai |
Stats
| Last Value | 1042.00 |
| Latest Period | Jan 2026 |
| Last Updated | Mar 23 2026, 14:15 EDT |
| Next Release | Jul 15 2026, 08:30 EDT (E) |
| Average Growth Rate | 3.60% |
| Value from Last Quarter | 1035.00 |
| Change from Last Quarter | 0.68% |
| Value from 1 Year Ago | 1008.00 |
| Change from 1 Year Ago | 3.37% |
| Frequency | Quarterly |
| Adjustment | N/A |
| Download Source File |