

US E-Commerce Sales (I:USECS)
Level Chart
Basic Info
|
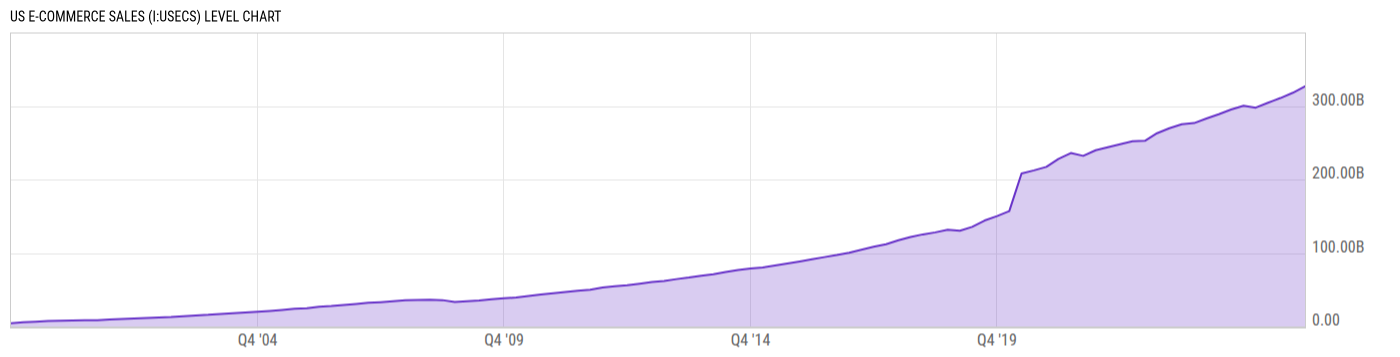
US E-Commerce Sales is at a current level of 326.74B, up from 318.00B last quarter and up from 297.70B one year ago. This is a change of 2.75% from last quarter and 9.75% from one year ago. |
|
US E-Commerce Sales reflect the sales of goods and services negotiated through an online medium, regardless of payment conditions. Growth in seasonally adjusted e-commerce sales can reflect an increase in US consumer sentiment, but also can be a result of a secular trend towards online shopping and away from shopping in physical stores that began in the early 2000s. Historically, year over year growth in e-commerce sales have outpaced year over year growth in total retail sales in the US, and thus are an increasingly important component of retail sales in the US. |
| Report | Quarterly E-Commerce Report |
| Category | Retail and Services Business Statistics |
| Region | United States |
| Source | Census Bureau |
Stats
| Last Value | 326.74B |
| Latest Period | Mar 2026 |
| Last Updated | May 18 2026, 10:02 EDT |
| Next Release | Aug 18 2026, 10:00 EDT |
| Average Growth Rate | 16.96% |
| Value from Last Quarter | 318.00B |
| Change from Last Quarter | 2.75% |
| Value from 1 Year Ago | 297.70B |
| Change from 1 Year Ago | 9.75% |
| Frequency | Quarterly |
| Unit | USD |
| Adjustment | Seasonally Adjusted |
| Download Source File |
Historical Data
| Date | Value |
|---|---|
| March 31, 2026 | 326.74B |
| December 31, 2025 | 318.00B |
| September 30, 2025 | 310.82B |
| June 30, 2025 | 304.46B |
| March 31, 2025 | 297.70B |
| December 31, 2024 | 300.33B |
| September 30, 2024 | 295.25B |
| June 30, 2024 | 288.82B |
| March 31, 2024 | 283.04B |
| December 31, 2023 | 276.78B |
| September 30, 2023 | 275.18B |
| June 30, 2023 | 269.74B |
| March 31, 2023 | 262.96B |
| December 31, 2022 | 252.66B |
| September 30, 2022 | 251.99B |
| June 30, 2022 | 247.97B |
| March 31, 2022 | 243.98B |
| December 31, 2021 | 239.82B |
| September 30, 2021 | 232.17B |
| June 30, 2021 | 236.01B |
| March 31, 2021 | 227.95B |
| December 31, 2020 | 217.16B |
| September 30, 2020 | 212.38B |
| June 30, 2020 | 208.11B |
| March 31, 2020 | 156.92B |
| Date | Value |
|---|---|
| December 31, 2019 | 150.24B |
| September 30, 2019 | 144.13B |
| June 30, 2019 | 135.55B |
| March 31, 2019 | 130.19B |
| December 31, 2018 | 131.61B |
| September 30, 2018 | 128.06B |
| June 30, 2018 | 125.31B |
| March 31, 2018 | 121.73B |
| December 31, 2017 | 117.27B |
| September 30, 2017 | 111.99B |
| June 30, 2017 | 108.42B |
| March 31, 2017 | 104.51B |
| December 31, 2016 | 100.45B |
| September 30, 2016 | 97.17B |
| June 30, 2016 | 94.38B |
| March 31, 2016 | 91.38B |
| December 31, 2015 | 88.35B |
| September 30, 2015 | 85.66B |
| June 30, 2015 | 82.91B |
| March 31, 2015 | 80.23B |
| December 31, 2014 | 79.02B |
| September 30, 2014 | 76.94B |
| June 30, 2014 | 74.29B |
| March 31, 2014 | 71.11B |
| December 31, 2013 | 69.10B |
News
Basic Info
|
US E-Commerce Sales is at a current level of 326.74B, up from 318.00B last quarter and up from 297.70B one year ago. This is a change of 2.75% from last quarter and 9.75% from one year ago. |
|
US E-Commerce Sales reflect the sales of goods and services negotiated through an online medium, regardless of payment conditions. Growth in seasonally adjusted e-commerce sales can reflect an increase in US consumer sentiment, but also can be a result of a secular trend towards online shopping and away from shopping in physical stores that began in the early 2000s. Historically, year over year growth in e-commerce sales have outpaced year over year growth in total retail sales in the US, and thus are an increasingly important component of retail sales in the US. |
| Report | Quarterly E-Commerce Report |
| Category | Retail and Services Business Statistics |
| Region | United States |
| Source | Census Bureau |
Stats
| Last Value | 326.74B |
| Latest Period | Mar 2026 |
| Last Updated | May 18 2026, 10:02 EDT |
| Next Release | Aug 18 2026, 10:00 EDT |
| Average Growth Rate | 16.96% |
| Value from Last Quarter | 318.00B |
| Change from Last Quarter | 2.75% |
| Value from 1 Year Ago | 297.70B |
| Change from 1 Year Ago | 9.75% |
| Frequency | Quarterly |
| Unit | USD |
| Adjustment | Seasonally Adjusted |
| Download Source File |
Related Securities
Related Indicators
| US Retail |
| US E-Commerce Sales as Percent of Retail Sales | 16.90% |
| US E-Commerce Sales QoQ | 2.75% |
| US E-Commerce Sales YoY | 9.75% |
| US Retail and Food Services Sales MoM | 0.22% |
| US Retail and Food Services Sales YoY | 6.72% |
| US Retail Sales MoM | 0.24% |
| US Retail Sales YoY | 7.19% |
| US Total Vehicle Sales YoY | 2.75% |