

Chicago, IL Unemployment Rate (I:CILUR)
Level Chart
Basic Info
|
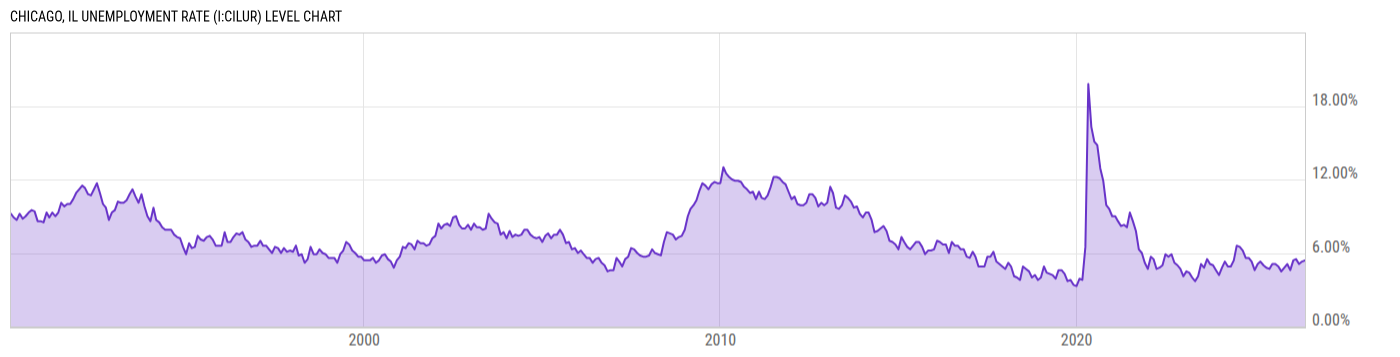
Chicago, IL Unemployment Rate is at 5.40%, compared to 5.30% last month and 4.70% last year. This is lower than the long term average of 7.43%. |
|
The Chicago, IL Unemployment Rate measures the percentage of total employees in Chicago, IL that are a part of the labor force, but are without a job. Following the financial crisis, the Chicago, IL Unemployment Rate reached as high as 13% in 2010. |
| Report | Metropolitan Area Employment and Unemployment |
| Categories | Employment , Hours and Wages |
| Region | N/A |
| Source | Bureau of Labor Statistics |
Stats
| Last Value | 5.40% |
| Latest Period | May 2026 |
| Last Updated | Jul 1 2026, 22:14 EDT |
| Next Release | Jul 29 2026, 10:00 EDT |
| Long Term Average | 7.43% |
| Average Growth Rate | 4.33% |
| Value from Last Month | 5.30% |
| Change from Last Month | 1.89% |
| Value from 1 Year Ago | 4.70% |
| Change from 1 Year Ago | 14.89% |
| Frequency | Monthly |
| Unit | Percent |
| Adjustment | Not Seasonally Adjusted |
| Download Source File |
Historical Data
| Date | Value |
|---|---|
| May 31, 2026 | 5.40% |
| April 30, 2026 | 5.30% |
| March 31, 2026 | 5.10% |
| February 28, 2026 | 5.50% |
| January 31, 2026 | 5.40% |
| December 31, 2025 | 4.60% |
| November 30, 2025 | 5.10% |
| October 31, 2025 | |
| September 30, 2025 | 4.50% |
| August 31, 2025 | 4.90% |
| July 31, 2025 | 5.10% |
| June 30, 2025 | 5.10% |
| May 31, 2025 | 4.70% |
| April 30, 2025 | 4.80% |
| March 31, 2025 | 5.00% |
| February 28, 2025 | 5.30% |
| January 31, 2025 | 5.10% |
| December 31, 2024 | 4.60% |
| November 30, 2024 | 5.30% |
| October 31, 2024 | 5.60% |
| September 30, 2024 | 5.60% |
| August 31, 2024 | 6.20% |
| July 31, 2024 | 6.50% |
| June 30, 2024 | 6.60% |
| May 31, 2024 | 5.40% |
| Date | Value |
|---|---|
| April 30, 2024 | 4.90% |
| March 31, 2024 | 4.90% |
| February 29, 2024 | 5.30% |
| January 31, 2024 | 4.80% |
| December 31, 2023 | 4.20% |
| November 30, 2023 | 4.60% |
| October 31, 2023 | 5.00% |
| September 30, 2023 | 5.10% |
| August 31, 2023 | 5.50% |
| July 31, 2023 | 4.80% |
| June 30, 2023 | 5.10% |
| May 31, 2023 | 4.10% |
| April 30, 2023 | 3.70% |
| March 31, 2023 | 4.00% |
| February 28, 2023 | 4.40% |
| January 31, 2023 | 4.50% |
| December 31, 2022 | 4.10% |
| November 30, 2022 | 4.70% |
| October 31, 2022 | 5.00% |
| September 30, 2022 | 5.20% |
| August 31, 2022 | 5.90% |
| July 31, 2022 | 5.70% |
| June 30, 2022 | 5.90% |
| May 31, 2022 | 5.00% |
| April 30, 2022 | 4.80% |
News
Basic Info
|
Chicago, IL Unemployment Rate is at 5.40%, compared to 5.30% last month and 4.70% last year. This is lower than the long term average of 7.43%. |
|
The Chicago, IL Unemployment Rate measures the percentage of total employees in Chicago, IL that are a part of the labor force, but are without a job. Following the financial crisis, the Chicago, IL Unemployment Rate reached as high as 13% in 2010. |
| Report | Metropolitan Area Employment and Unemployment |
| Categories | Employment , Hours and Wages |
| Region | N/A |
| Source | Bureau of Labor Statistics |
Stats
| Last Value | 5.40% |
| Latest Period | May 2026 |
| Last Updated | Jul 1 2026, 22:14 EDT |
| Next Release | Jul 29 2026, 10:00 EDT |
| Long Term Average | 7.43% |
| Average Growth Rate | 4.33% |
| Value from Last Month | 5.30% |
| Change from Last Month | 1.89% |
| Value from 1 Year Ago | 4.70% |
| Change from 1 Year Ago | 14.89% |
| Frequency | Monthly |
| Unit | Percent |
| Adjustment | Not Seasonally Adjusted |
| Download Source File |
Related Indicators
| City Unemployment Rates |
| Illinois Economy |
| Illinois GDP | 913.68B Chn 2017 USD |
| Illinois GDP YoY | 1.62% |
| Illinois Labor Force | 6.542M |
| Illinois Nonfarm Payrolls MoM | 6.00K |
| Illinois Unemployment Rate | 5.10% |