

Excel Add-In
Microsoft Excel is at the core of financial analysis. But entering data is not only tedious, it's also time consuming. Our Excel Add-In allows you to create a model once, then update it with a single click.
Automate Your Financial Models
- Inject our financial data into your comparable analyses, portfolio performance tracking, custom benchmarking, indexing projects or any of your other core research models.
- Update your entire spreadsheet with the most recent data with one click.
- Use cell references for metric codes, dates, and companies for easy modifications to in-depth models.
Leverage Our Expertise
- Work with one of our dedicated experts to convert your existing models with our syntax.
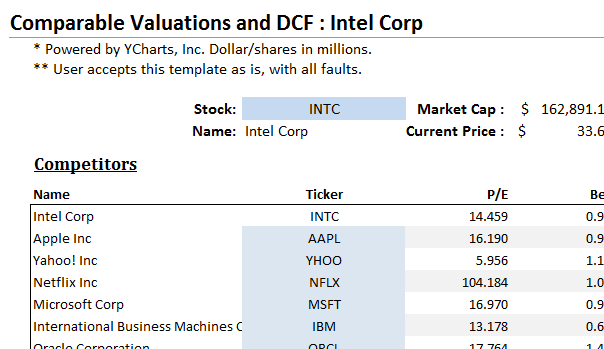
- Get started with one of our pre-built templates; several are available to download and begin using immediately.
- Learn the ins and outs from your personal account support specialist.
Proprietize Your Presentations
- Make your points by combining our data with your own proprietary figures to create charts or tables.
- Maintain your branding throughout your presentations by creating customized visuals powered with our data.
YCharts’ Excel Add-In is available with a subscription. Learn more about the data and see it in action, please contact a sales representative today.
QUESTIONS?
- Email: support@ycharts.com
- Call: (866) 965-7552
READY TO GET STARTED?
Unlock My AccessAccess the Excel Add-In Now
Unlock access to the Excel Add-In by registering below. No credit card required.
Unlock My AccessQUESTIONS?
- Email: support@ycharts.com
- Call: (866) 965-7552