

Dashboard
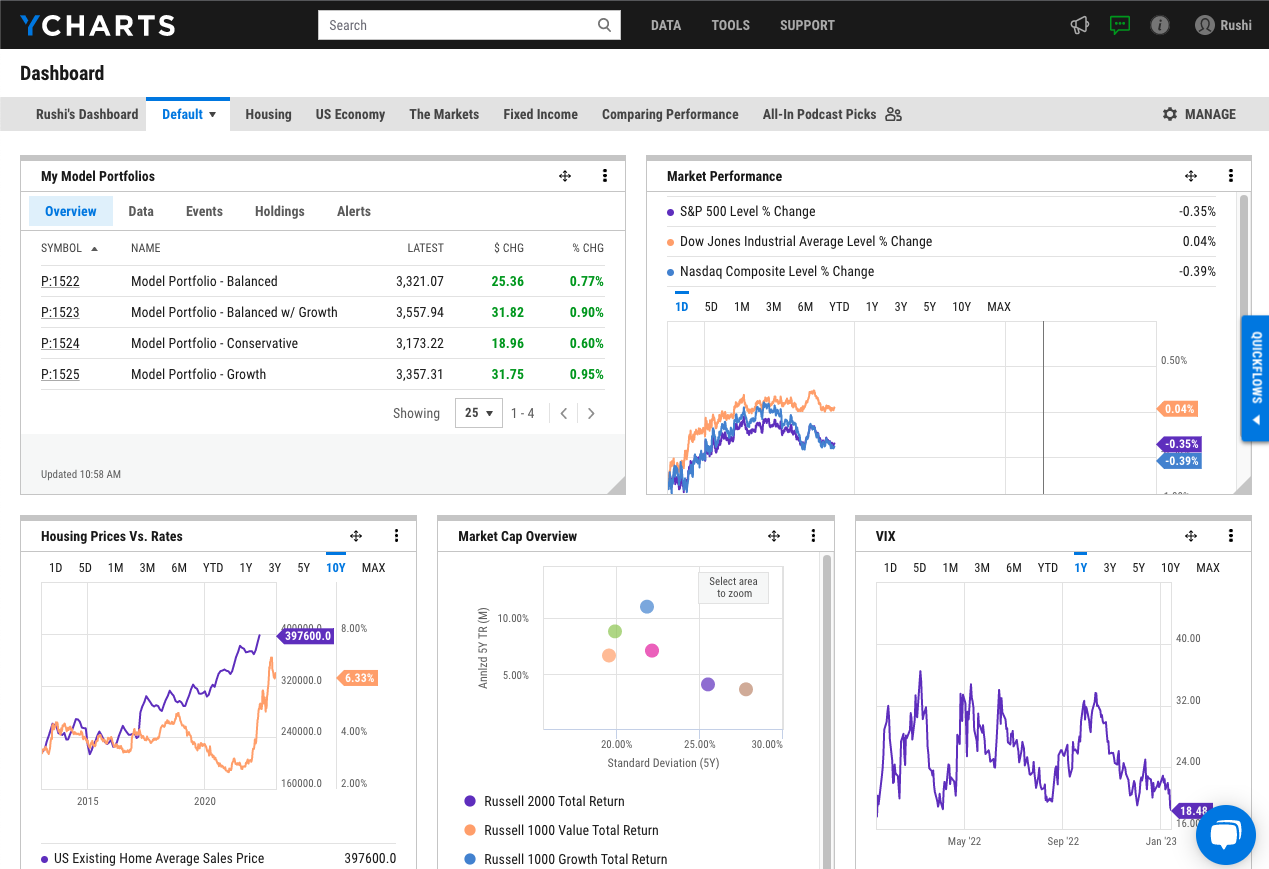
The Dashboard on YCharts allows you to build out a custom view of charts, security lists, news, scatter plots, and so much more to serve your market monitoring needs. These custom dashboards can be built using various types of data points and securities including stocks, funds, portfolios, economic datasets, and more. Some examples include having a dashboard of your client’s holdings so that you are always informed on their performance or creating an economic data dashboard to stay abreast of new important economic data being released. You can build a dashboard from scratch, or use one of the useful templates to get started.
Have a central location for all of your important market information
The fully customizable dashboard allows you to create a setup that you can have open throughout the day with the market information that matters to you. The vast dataset on YCharts allows you to pull in any market information or economic data that you track.
Be ready for your client calls by always having a pulse on the markets
Access intraday data on stocks, indices, and ETFs on your dashboard. With custom watchlists, security lists, and charts, all the market data you need is accessible at your fingertips with the dashboard. Create watchlists of your client’s holdings, and set an alert to notify you if a holding is up or down so that you can be proactive with your outreach to your clients.
Centralize all of your important saved YCharts visuals and lists
The dashboard allows you to pull in charts, scatter plots, security lists, saved screens, and more all in one place. This central location brings all your important data to one place and updates automatically.
QUESTIONS?
- Email: support@ycharts.com
- Call: (866) 965-7552
READY TO GET STARTED?
Unlock My AccessAccess the Dashboard Now
Unlock access to the Dashboard by registering below. No credit card required.
Unlock My AccessQUESTIONS?
- Email: support@ycharts.com
- Call: (866) 965-7552