

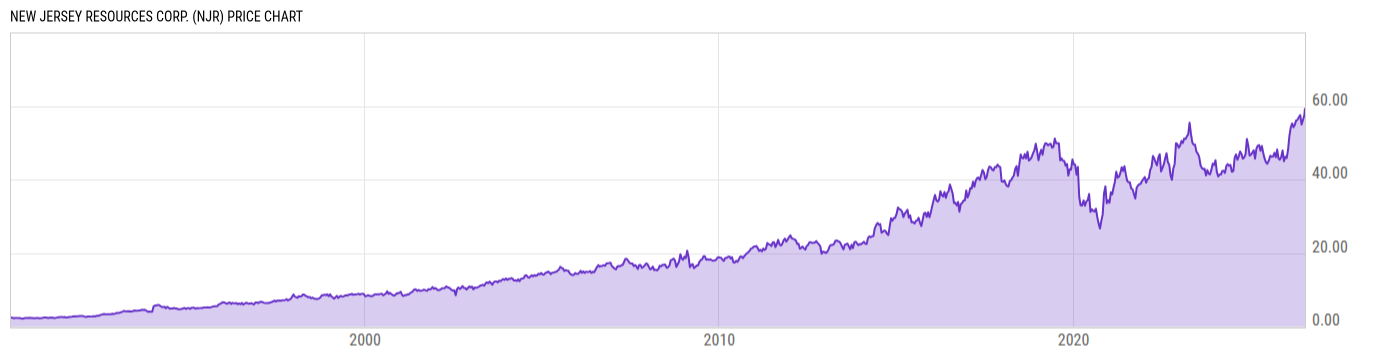
New Jersey Resources Corp. (NJR)
58.76
-0.45
(-0.76%)
USD |
NYSE |
Jul 14, 16:00
58.78
+0.02
(+0.03%)
Pre-Market: 20:00
Price Chart
Key Stats
| Price and Performance | |
|---|---|
| Market Cap | 5.927B |
| 52 Week High (Daily) | |
| 52 Week Low (Daily) | |
| All-Time High (Daily) | |
| Year to Date Total Returns (Daily) | |
| 1 Month Total Returns (Daily) | |
| 1 Year Total Returns (Daily) | 31.97% |
| Valuation | |
| PE Ratio | 17.45 |
| PE Ratio (Forward) | |
| PS Ratio | 2.685 |
| Price to Book Value | 2.238 |
| EV to EBITDA | |
| Dividend | |
|---|---|
| Dividend | 0.475 |
| Dividend Yield (Forward) | |
| Financials | |
| Revenue (5 Year Growth) | |
| Revenue (Quarterly YoY Growth) | |
| EPS Diluted (5 Year Growth) | |
| EPS Diluted (Quarterly YoY Growth) | |
| Debt to Equity Ratio | 1.421 |
| Return on Equity | |
| Return on Assets | |
| Risk | |
| Beta (5Y) | |
| Max Drawdown (5Y) | 27.78% |
Profile
| New Jersey Resources Corp. is a holding company, which engages in the provision of regulated natural gas distribution services, transmission and storage services, and operates certain unregulated businesses. It operates through the following segments: Natural Gas Distribution, Clean Energy Ventures, Energy Services, Storage and Transportation, and Home Services and Other. The Natural Gas Distribution segment regulates natural gas services, off-system sales, capacity, and storage management operations. The Clean Energy Ventures segment consists of capital investments in clean energy projects. The Energy Services segment refers to the unregulated wholesale and retail energy operations, as well as energy management services. The Storage and Transportation segment is involved in the investments in the natural gas storage and transportation market, such as natural gas storage and transportation facilities. The company was founded in 1981 and is headquartered in Wall, NJ. |
| URL | http://www.njresources.com |
| Investor Relations URL | https://investor.njresources.com |
| HQ State/Province | New Jersey |
| Sector | Utilities |
| Industry | Gas Utilities |
| Equity Style | Small Cap Value |
| Next Earnings Release | Aug. 03, 2026 |
| Last Earnings Release | May. 04, 2026 |
| Next Ex-Dividend Date | N/A |
| Last Ex-Dividend Date | Jun. 10, 2026 |