

Robinhood Markets, Inc. (HOOD)
115.53
+2.08
(+1.83%)
USD |
NASDAQ |
Jul 15, 16:00
115.59
+0.06
(+0.05%)
After-Hours: 20:00
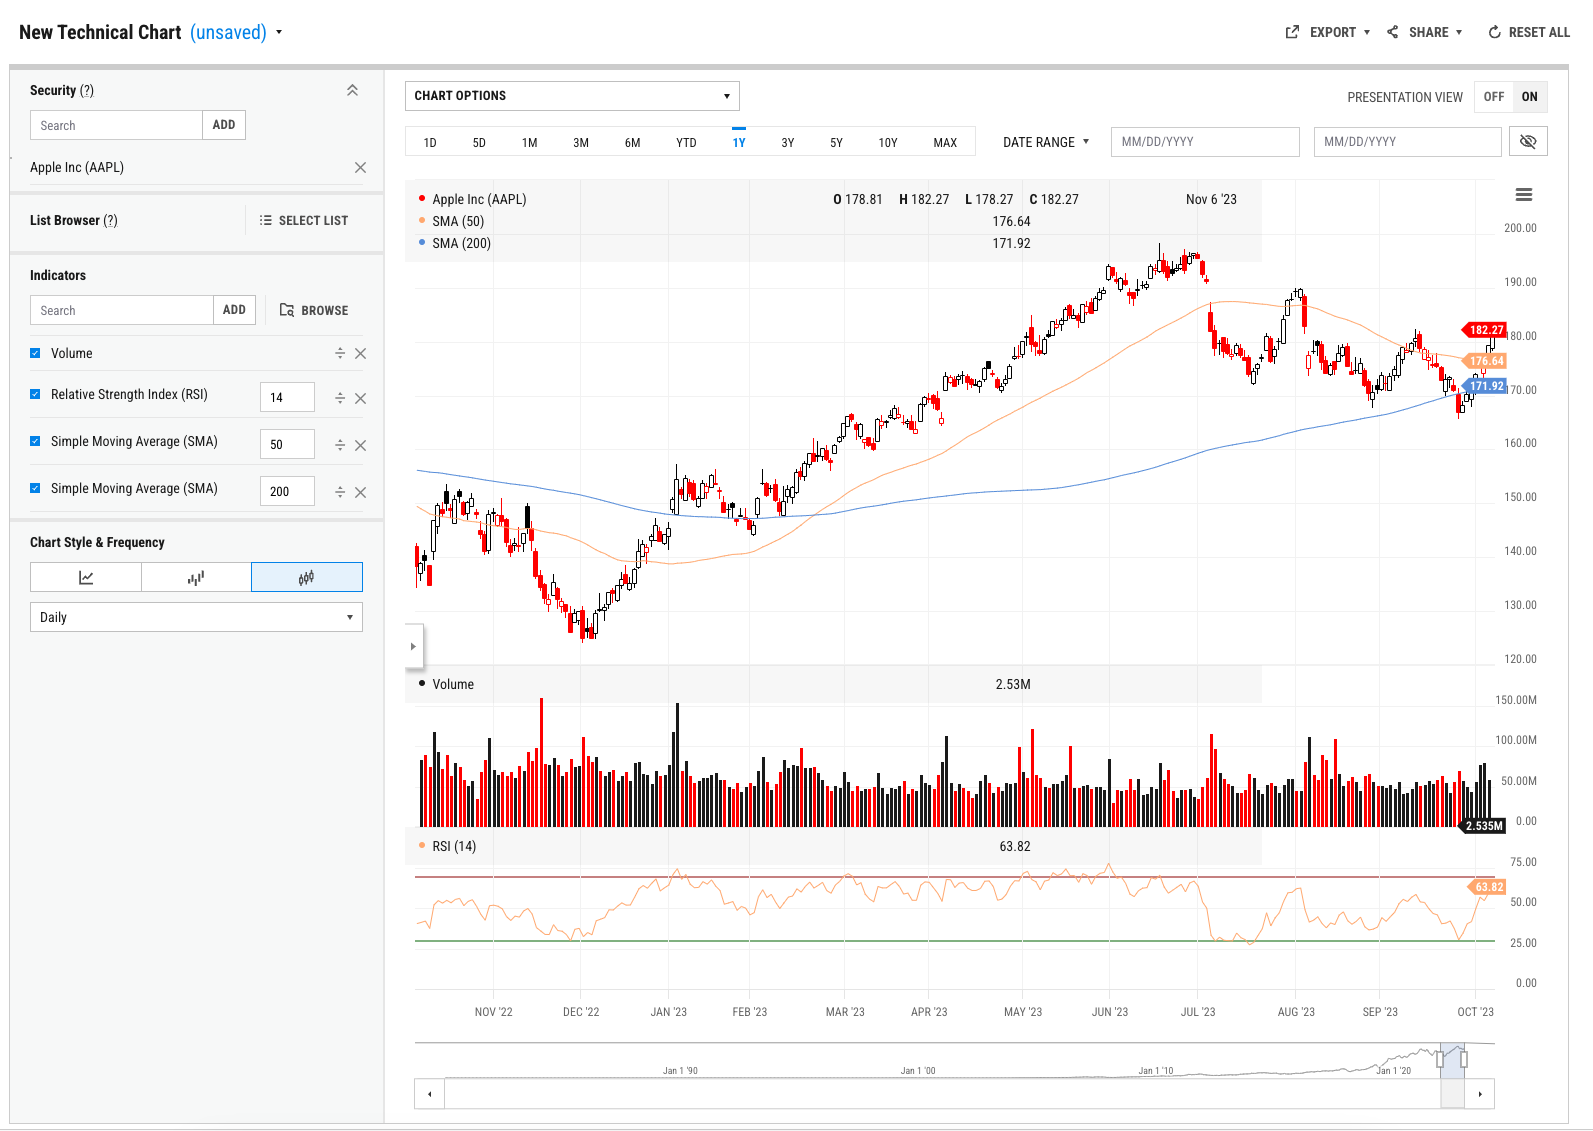
Technical Chart
The Technical Chart tool enables you to create a chart within YCharts that can calculate various technical indicators. Once you choose a security or list, you can pick a combination of technical indicators to chart.
QUESTIONS?
- Email: support@ycharts.com
- Call: (866) 965-7552
READY TO GET STARTED?
Unlock My AccessAccess Technical Chart Now
Unlock access to Technical Chart by registering below. No credit card required.
Unlock My AccessQUESTIONS?
- Email: support@ycharts.com
- Call: (866) 965-7552