

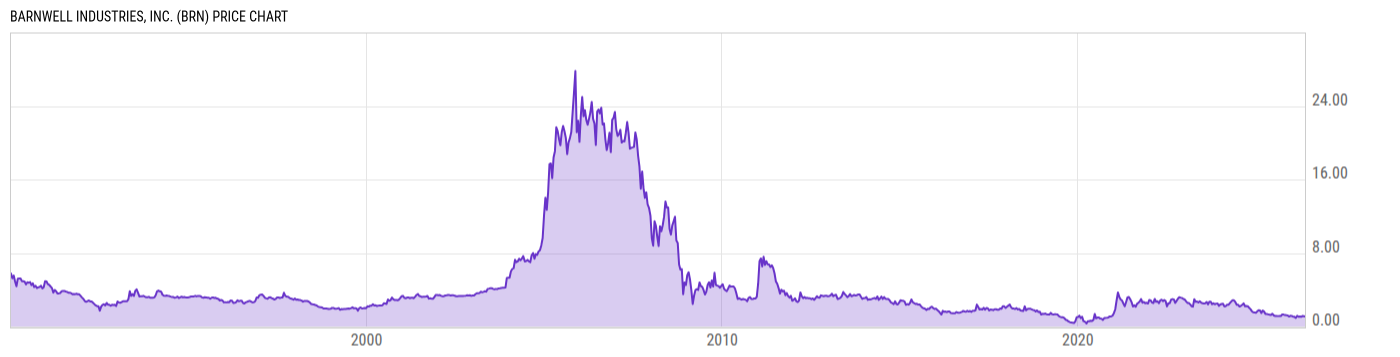
Barnwell Industries, Inc. (BRN)
1.05
-0.02
(-1.87%)
USD |
NYAM |
Jun 08, 16:00
1.06
+0.01
(+0.95%)
After-Hours: 20:00
Price Chart
Key Stats
| Price and Performance | |
|---|---|
| Market Cap | 14.18M |
| 52 Week High (Daily) | |
| 52 Week Low (Daily) | |
| All-Time High (Daily) | |
| Year to Date Total Returns (Daily) | |
| 1 Month Total Returns (Daily) | |
| 1 Year Total Returns (Daily) | -15.97% |
| Valuation | |
| PE Ratio | -- |
| PE Ratio (Forward) | |
| PS Ratio | 1.010 |
| Price to Book Value | 1.744 |
| EV to EBITDA | |
| Dividend | |
|---|---|
| Dividend | -- |
| Dividend Yield (Forward) | |
| Financials | |
| Revenue (5 Year Growth) | |
| Revenue (Quarterly YoY Growth) | |
| EPS Diluted (5 Year Growth) | |
| EPS Diluted (Quarterly YoY Growth) | |
| Debt to Equity Ratio | 0.0082 |
| Return on Equity | |
| Return on Assets | |
| Risk | |
| Beta (5Y) | |
| Max Drawdown (5Y) | 81.25% |
Profile
| Barnwell Industries, Inc. engages in oil and natural gas exploration and land investment. It operates through the Oil and Natural Gas and Land Investment segments. The Oil and Natural Gas segment manages the exploration, development, production and sale of oil and natural gas in Canada. The Land Investment segment invests in land interest in Hawaii. The company was founded by Morton H. Kinzler in 1956 and is headquartered in Houston, TX. |
| URL | http://www.brninc.com |
| Investor Relations URL | N/A |
| HQ State/Province | Texas |
| Sector | Energy |
| Industry | Oil, Gas & Consumable Fuels |
| Next Earnings Release | N/A |
| Last Earnings Release | Dec. 19, 2022 |
| Next Ex-Dividend Date | N/A |
| Last Ex-Dividend Date | Aug. 23, 2023 |