

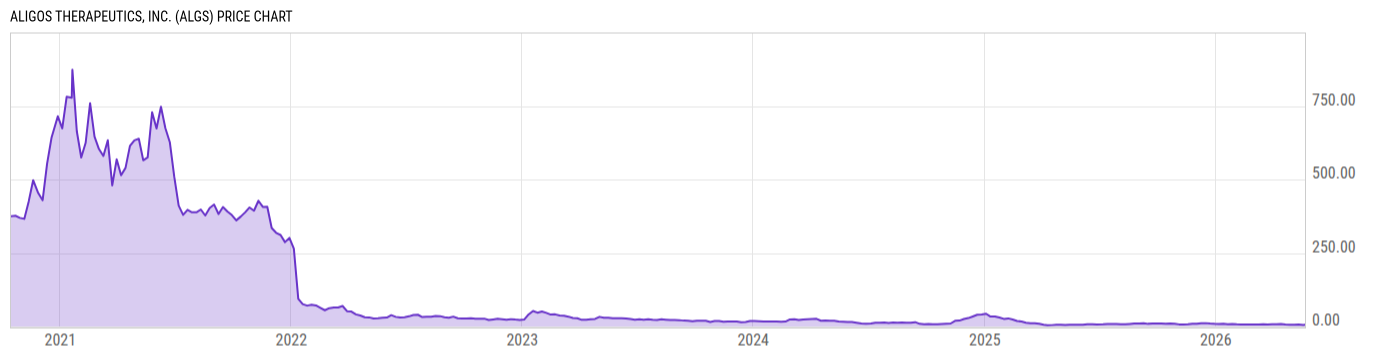
Aligos Therapeutics, Inc. (ALGS)
5.76
+0.05
(+0.88%)
USD |
NASDAQ |
May 22, 16:00
5.77
+0.01
(+0.17%)
After-Hours: 07:18
Price Chart
Key Stats
| Price and Performance | |
|---|---|
| Market Cap | 35.64M |
| 52 Week High (Daily) | |
| 52 Week Low (Daily) | |
| All-Time High (Daily) | |
| Year to Date Total Returns (Daily) | |
| 1 Month Total Returns (Daily) | |
| 1 Year Total Returns (Daily) | 1.59% |
| Valuation | |
| PE Ratio | -- |
| PE Ratio (Forward) | |
| PS Ratio | 12.70 |
| Price to Book Value | 1.121 |
| EV to EBITDA | |
| Dividend | |
|---|---|
| Dividend | -- |
| Dividend Yield (Forward) | |
| Financials | |
| Revenue (5 Year Growth) | |
| Revenue (Quarterly YoY Growth) | |
| EPS Diluted (5 Year Growth) | |
| EPS Diluted (Quarterly YoY Growth) | |
| Debt to Equity Ratio | 0.1369 |
| Return on Equity | |
| Return on Assets | |
| Risk | |
| Beta (5Y) | |
| Max Drawdown (5Y) | 99.54% |
Profile
| Aligos Therapeutics, Inc. is a clinical-stage biopharmaceutical company, which engages in the provision of therapeutics for chronic liver diseases and viral infections. The firm is focused on the discovery and development of targeted antiviral therapies for chronic hepatitis B (CHB) and coronaviruses, as well as leveraging its expertise in liver diseases to create targeted therapeutics for nonalcoholic steatohepatitis (NASH). The company was founded by Lucinda Quan and Lawrence M. Blatt on February 5, 2018 and is headquartered in South San Francisco, CA. |
| URL | http://www.aligos.com |
| Investor Relations URL | https://investor.aligos.com/ |
| HQ State/Province | California |
| Sector | Health Care |
| Industry | Biotechnology |
| Next Earnings Release | Aug. 06, 2026 (est.) |
| Last Earnings Release | May. 07, 2026 |
| Next Ex-Dividend Date | N/A |
| Last Ex-Dividend Date | N/A |