

US Public Debt as Percent of GDP (I:USPDGDP)
Level Chart
Basic Info
|
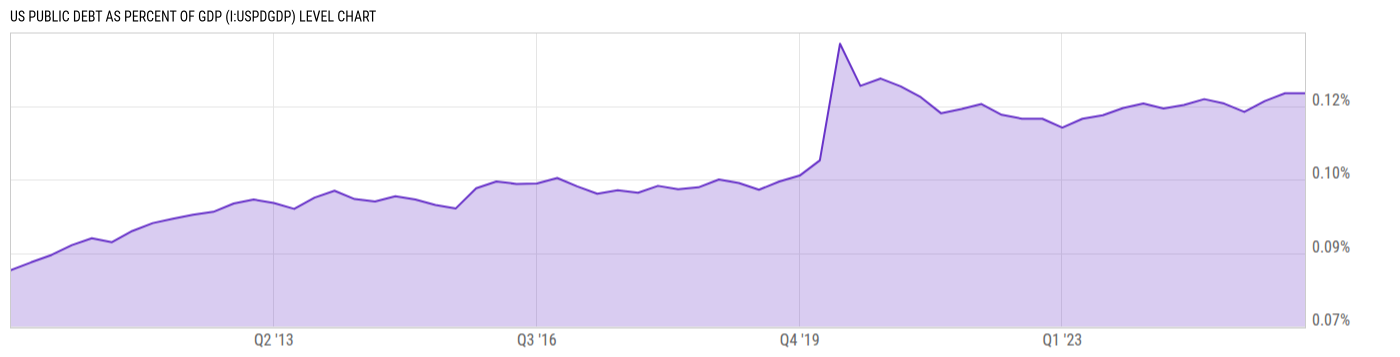
US Public Debt as Percent of GDP is at 0.12%, compared to 0.12% last quarter and 0.12% last year. This is higher than the long term average of 0.11%. |
|
US Public Debt measures the total public debt in the United States divided by the total GDP in that same period. In a global context, as the percentage of debt increases compared to the GDP, the probability of defaulting increases, as the ability to pay back debt decreases. When comparing public debt of different economies, this measure allows to see how debt grows in real terms compared to the size of the underlying national economy. In other words, one can compare how an economy's use of debt contributes to growth in GDP. Historically, the US public debt as a percentage of GDP has steadily increased during the 2000s from a trough of 54.24% in 2000 Q4, to a peak of 105.3% in 2016 Q4. |
| Report | Treasury Bulletin |
| Category | Governmental Statistics |
| Region | United States |
| Source | Department of the Treasury |
Stats
| Last Value | 0.12% |
| Latest Period | Mar 2026 |
| Last Updated | Jul 10 2026, 13:23 EDT |
| Next Release | Sep 15 2026, 14:00 EDT (E) |
| Long Term Average | 0.11% |
| Average Growth Rate | 2.36% |
| Value from Last Quarter | 0.12% |
| Change from Last Quarter | 0.00% |
| Value from 1 Year Ago | 0.12% |
| Change from 1 Year Ago | 1.74% |
| Frequency | Quarterly |
| Unit | Percent of GDP |
| Adjustment | N/A |
| Notes | Total US Public Debt divided by Gross Domestic Product. |
| Formula | US Public Debt / US GDP * 0.01 |
Historical Data
| Date | Value |
|---|---|
| March 31, 2026 | 0.12% |
| December 31, 2025 | 0.12% |
| September 30, 2025 | 0.12% |
| June 30, 2025 | 0.12% |
| March 31, 2025 | 0.12% |
| December 31, 2024 | 0.12% |
| September 30, 2024 | 0.12% |
| June 30, 2024 | 0.12% |
| March 31, 2024 | 0.12% |
| December 31, 2023 | 0.12% |
| September 30, 2023 | 0.12% |
| June 30, 2023 | 0.12% |
| March 31, 2023 | 0.12% |
| December 31, 2022 | 0.12% |
| September 30, 2022 | 0.12% |
| June 30, 2022 | 0.12% |
| March 31, 2022 | 0.12% |
| December 31, 2021 | 0.12% |
| September 30, 2021 | 0.12% |
| June 30, 2021 | 0.12% |
| March 31, 2021 | 0.12% |
| December 31, 2020 | 0.13% |
| September 30, 2020 | 0.12% |
| June 30, 2020 | 0.13% |
| March 31, 2020 | 0.11% |
| Date | Value |
|---|---|
| December 31, 2019 | 0.11% |
| September 30, 2019 | 0.10% |
| June 30, 2019 | 0.10% |
| March 31, 2019 | 0.10% |
| December 31, 2018 | 0.10% |
| September 30, 2018 | 0.10% |
| June 30, 2018 | 0.10% |
| March 31, 2018 | 0.10% |
| December 31, 2017 | 0.10% |
| September 30, 2017 | 0.10% |
| June 30, 2017 | 0.10% |
| March 31, 2017 | 0.10% |
| December 31, 2016 | 0.11% |
| September 30, 2016 | 0.10% |
| June 30, 2016 | 0.10% |
| March 31, 2016 | 0.10% |
| December 31, 2015 | 0.10% |
| September 30, 2015 | 0.10% |
| June 30, 2015 | 0.10% |
| March 31, 2015 | 0.10% |
| December 31, 2014 | 0.10% |
| September 30, 2014 | 0.10% |
| June 30, 2014 | 0.10% |
| March 31, 2014 | 0.10% |
| December 31, 2013 | 0.10% |
News
Basic Info
|
US Public Debt as Percent of GDP is at 0.12%, compared to 0.12% last quarter and 0.12% last year. This is higher than the long term average of 0.11%. |
|
US Public Debt measures the total public debt in the United States divided by the total GDP in that same period. In a global context, as the percentage of debt increases compared to the GDP, the probability of defaulting increases, as the ability to pay back debt decreases. When comparing public debt of different economies, this measure allows to see how debt grows in real terms compared to the size of the underlying national economy. In other words, one can compare how an economy's use of debt contributes to growth in GDP. Historically, the US public debt as a percentage of GDP has steadily increased during the 2000s from a trough of 54.24% in 2000 Q4, to a peak of 105.3% in 2016 Q4. |
| Report | Treasury Bulletin |
| Category | Governmental Statistics |
| Region | United States |
| Source | Department of the Treasury |
Stats
| Last Value | 0.12% |
| Latest Period | Mar 2026 |
| Last Updated | Jul 10 2026, 13:23 EDT |
| Next Release | Sep 15 2026, 14:00 EDT (E) |
| Long Term Average | 0.11% |
| Average Growth Rate | 2.36% |
| Value from Last Quarter | 0.12% |
| Change from Last Quarter | 0.00% |
| Value from 1 Year Ago | 0.12% |
| Change from 1 Year Ago | 1.74% |
| Frequency | Quarterly |
| Unit | Percent of GDP |
| Adjustment | N/A |
| Notes | Total US Public Debt divided by Gross Domestic Product. |
| Formula | US Public Debt / US GDP * 0.01 |
Related Indicators
| US Economy |
| ADP Employment Change | 98000.00 |
| Effective Federal Funds Rate | 3.62% |
| US Durable Goods New Orders MoM | -4.48% |
| US Housing Starts MoM | -15.45% |
| US Imports MoM | 3.27% |
| US Index of Consumer Sentiment | 49.50 |
| US Inflation Rate | 4.20% |
| US Initial Claims for Unemployment Insurance | 215000.0 |
| US ISM Manufacturing PMI | 53.30 |
| US Real GDP QoQ | 2.10% |
| US Retail and Food Services Sales MoM | 0.88% |
| US Unemployment Rate | 4.20% |