

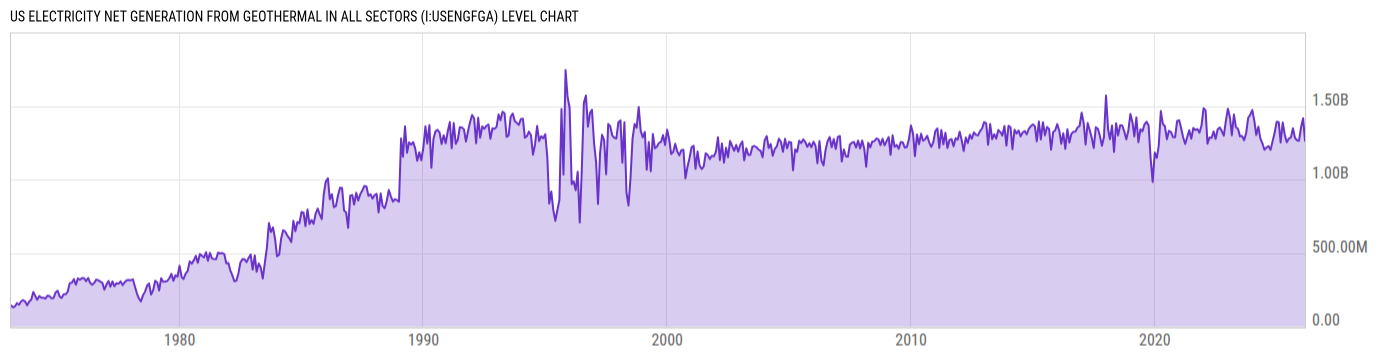
US Electricity Net Generation From Geothermal in All Sectors (I:USENGFGA)
1.263B kWh for Feb 2026
Level Chart
Basic Info
|
US Electricity Net Generation From Geothermal in All Sectors is at a current level of 1.263B, down from 1.417B last month and up from 1.252B one year ago. This is a change of -10.84% from last month and 0.92% from one year ago. |
| Report | Monthly Energy Review |
| Category | Energy |
| Region | United States |
| Source | Energy Information Administration |
Stats
| Last Value | 1.263B |
| Latest Period | Feb 2026 |
| Last Updated | May 26 2026, 14:24 EDT |
| Next Release | Jun 25 2026, 14:00 EDT |
| Average Growth Rate | 10.73% |
| Value from Last Month | 1.417B |
| Change from Last Month | -10.84% |
| Value from 1 Year Ago | 1.252B |
| Change from 1 Year Ago | 0.92% |
| Frequency | Monthly |
| Unit | Kilowatthours |
| Adjustment | N/A |
| Download Source File |
Historical Data
| Date | Value |
|---|---|
| February 28, 2026 | 1.263B |
| January 31, 2026 | 1.417B |
| December 31, 2025 | 1.355B |
| November 30, 2025 | 1.263B |
| October 31, 2025 | 1.267B |
| September 30, 2025 | 1.284B |
| August 31, 2025 | 1.349B |
| July 31, 2025 | 1.285B |
| June 30, 2025 | 1.278B |
| May 31, 2025 | 1.253B |
| April 30, 2025 | 1.306B |
| March 31, 2025 | 1.388B |
| February 28, 2025 | 1.252B |
| January 31, 2025 | 1.389B |
| December 31, 2024 | 1.393B |
| November 30, 2024 | 1.317B |
| October 31, 2024 | 1.261B |
| September 30, 2024 | 1.201B |
| August 31, 2024 | 1.227B |
| July 31, 2024 | 1.218B |
| June 30, 2024 | 1.202B |
| May 31, 2024 | 1.246B |
| April 30, 2024 | 1.280B |
| March 31, 2024 | 1.359B |
| February 29, 2024 | 1.303B |
| Date | Value |
|---|---|
| January 31, 2024 | 1.399B |
| December 31, 2023 | 1.473B |
| November 30, 2023 | 1.440B |
| October 31, 2023 | 1.420B |
| September 30, 2023 | 1.315B |
| August 31, 2023 | 1.267B |
| July 31, 2023 | 1.296B |
| June 30, 2023 | 1.293B |
| May 31, 2023 | 1.345B |
| April 30, 2023 | 1.356B |
| March 31, 2023 | 1.442B |
| February 28, 2023 | 1.302B |
| January 31, 2023 | 1.420B |
| December 31, 2022 | 1.482B |
| November 30, 2022 | 1.397B |
| October 31, 2022 | 1.298B |
| September 30, 2022 | 1.329B |
| August 31, 2022 | 1.354B |
| July 31, 2022 | 1.341B |
| June 30, 2022 | 1.276B |
| May 31, 2022 | 1.327B |
| April 30, 2022 | 1.282B |
| March 31, 2022 | 1.286B |
| February 28, 2022 | 1.243B |
| January 31, 2022 | 1.470B |
News
Headline
Time (ET)
05/22 15:56
05/12 15:59
Basic Info
|
US Electricity Net Generation From Geothermal in All Sectors is at a current level of 1.263B, down from 1.417B last month and up from 1.252B one year ago. This is a change of -10.84% from last month and 0.92% from one year ago. |
| Report | Monthly Energy Review |
| Category | Energy |
| Region | United States |
| Source | Energy Information Administration |
Stats
| Last Value | 1.263B |
| Latest Period | Feb 2026 |
| Last Updated | May 26 2026, 14:24 EDT |
| Next Release | Jun 25 2026, 14:00 EDT |
| Average Growth Rate | 10.73% |
| Value from Last Month | 1.417B |
| Change from Last Month | -10.84% |
| Value from 1 Year Ago | 1.252B |
| Change from 1 Year Ago | 0.92% |
| Frequency | Monthly |
| Unit | Kilowatthours |
| Adjustment | N/A |
| Download Source File |