

Economic Indicators
Use YCharts to explore economic trends, tap into reliable data, and create stunning, brand-enhancing visuals.
Delve into the World of Economic Data
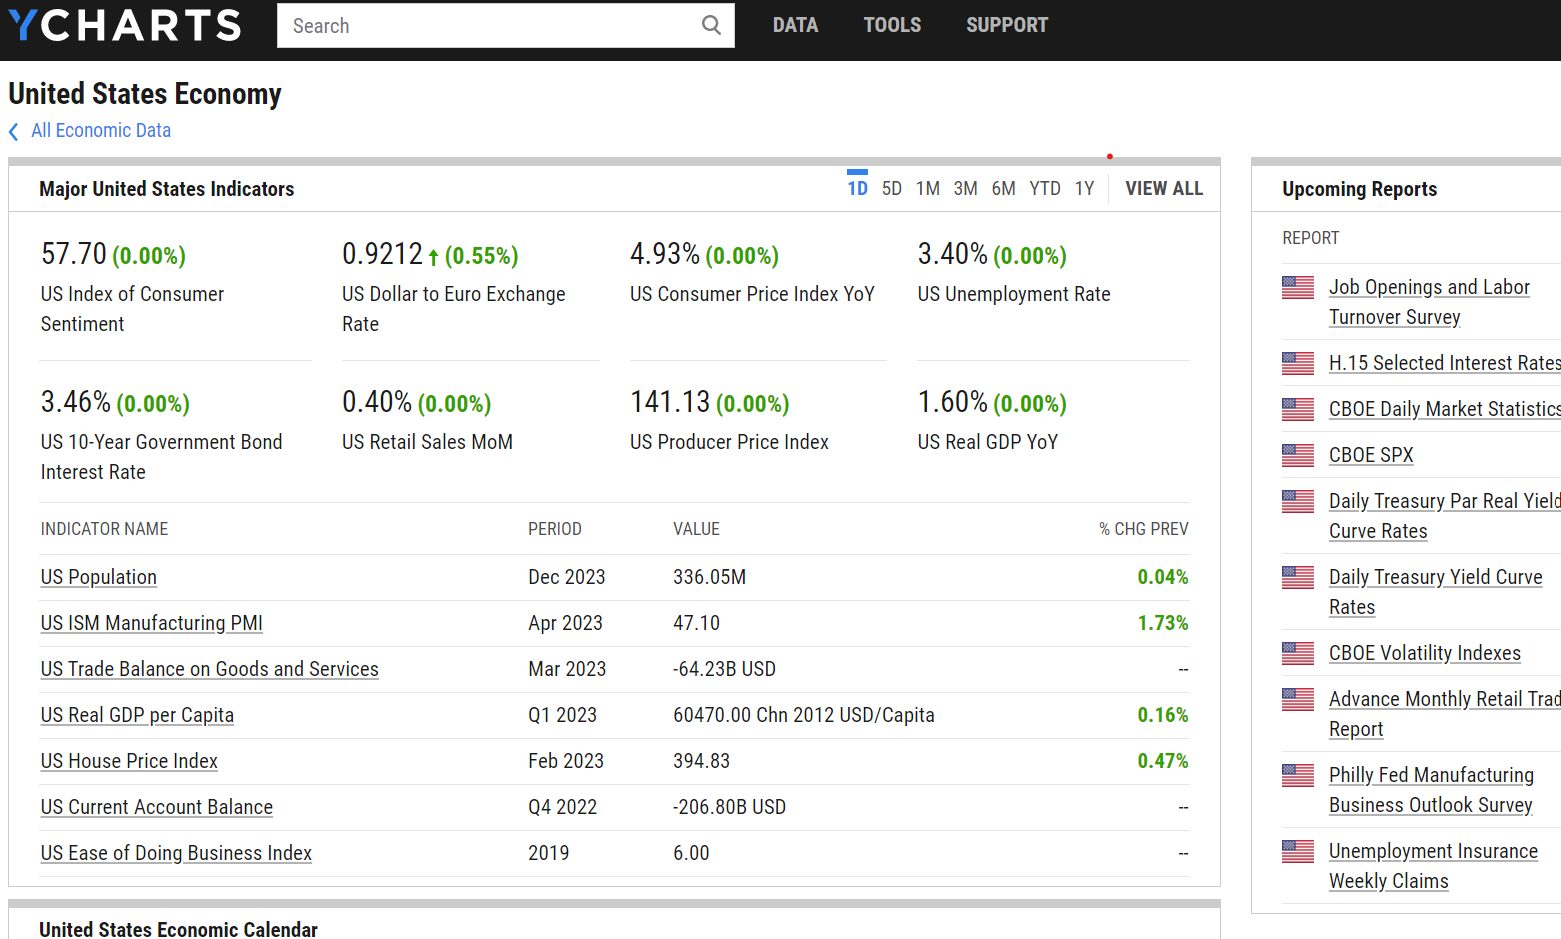
With YCharts, navigate the intricate landscape of global economic indicators. YCharts offers an industry-leading compilation of over 500,000 economic indicators and data points, so you (and your clients) can fully understand global economic trends.
Tap into a Reservoir of Reliable Global Economic Data
With YCharts, access a comprehensive array of reliable economic data from reputable institutions such as the Federal Reserve and Bureau of Labor Statistics, among others. This wealth of information offers a complete view of the world's economies and facilitates informed decision-making.
Visualize Economic Data in Striking Detail
With YCharts, transform vast economic data into compelling visuals encapsulating complex trends and insights. Customizable with your firm's logo, these visuals not only enhance your research but also strengthen your brand's presence.
QUESTIONS?
- Email: support@ycharts.com
- Call: (866) 965-7552
READY TO GET STARTED?
Unlock My AccessAccess Economic Indicators Now
Unlock access to Economic Indicators by registering below. No credit card required.
Unlock My AccessQUESTIONS?
- Email: support@ycharts.com
- Call: (866) 965-7552