

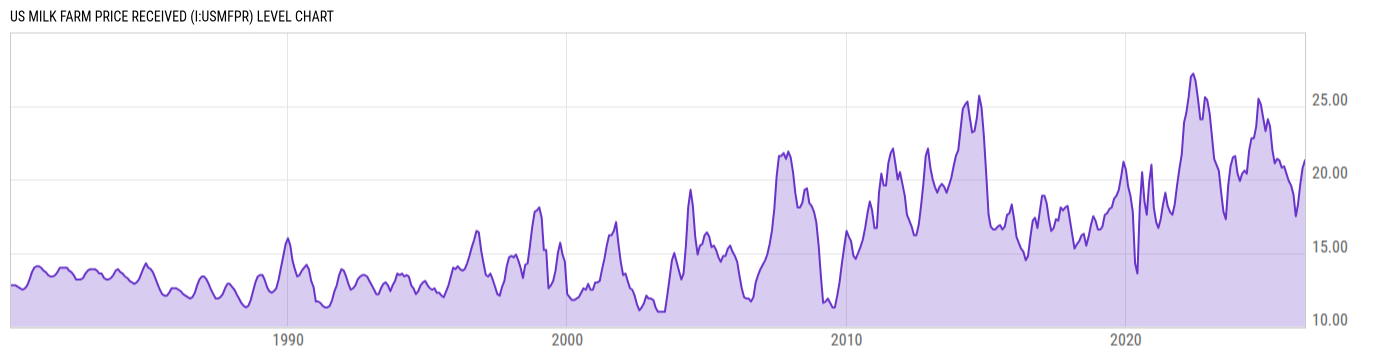
US Milk Farm Price Received (I:USMFPR)
21.30 USD/cwt for May 2026
Level Chart
Basic Info
|
US Milk Farm Price Received is at a current level of 21.30, up from 20.80 last month and down from 21.40 one year ago. This is a change of 2.40% from last month and -0.47% from one year ago. |
| Report | USDA Farm Price Received |
| Category | Agriculture and Livestock |
| Region | United States |
| Source | US Department of Agriculture |
Stats
| Last Value | 21.30 |
| Latest Period | May 2026 |
| Last Updated | Jul 3 2026, 10:01 EDT |
| Next Release | Aug 3 2026, 10:00 EDT (E) |
| Average Growth Rate | 2.37% |
| Value from Last Month | 20.80 |
| Change from Last Month | 2.40% |
| Value from 1 Year Ago | 21.40 |
| Change from 1 Year Ago | -0.47% |
| Frequency | Monthly |
| Unit | USD per Hundred Weight |
| Adjustment | N/A |
| Download Source File | |
| Notes | Monthly average farm price received. |
Historical Data
| Date | Value |
|---|---|
| May 31, 2026 | 21.30 |
| April 30, 2026 | 20.80 |
| March 31, 2026 | 19.70 |
| February 28, 2026 | 18.30 |
| January 31, 2026 | 17.50 |
| December 31, 2025 | 19.00 |
| November 30, 2025 | 19.60 |
| October 31, 2025 | 19.90 |
| September 30, 2025 | 20.40 |
| August 31, 2025 | 20.90 |
| July 31, 2025 | 20.80 |
| June 30, 2025 | 21.30 |
| May 31, 2025 | 21.40 |
| April 30, 2025 | 21.10 |
| March 31, 2025 | 22.00 |
| February 28, 2025 | 23.60 |
| January 31, 2025 | 24.10 |
| December 31, 2024 | 23.30 |
| November 30, 2024 | 24.20 |
| October 31, 2024 | 25.10 |
| September 30, 2024 | 25.50 |
| August 31, 2024 | 23.60 |
| July 31, 2024 | 22.80 |
| June 30, 2024 | 22.80 |
| May 31, 2024 | 22.00 |
| Date | Value |
|---|---|
| April 30, 2024 | 20.40 |
| March 31, 2024 | 20.60 |
| February 29, 2024 | 20.40 |
| January 31, 2024 | 19.90 |
| December 31, 2023 | 20.40 |
| November 30, 2023 | 21.60 |
| October 31, 2023 | 21.50 |
| September 30, 2023 | 20.90 |
| August 31, 2023 | 19.60 |
| July 31, 2023 | 17.30 |
| June 30, 2023 | 17.80 |
| May 31, 2023 | 19.10 |
| April 30, 2023 | 20.60 |
| March 31, 2023 | 21.00 |
| February 28, 2023 | 21.40 |
| January 31, 2023 | 22.90 |
| December 31, 2022 | 24.50 |
| November 30, 2022 | 25.40 |
| October 31, 2022 | 25.60 |
| September 30, 2022 | 24.10 |
| August 31, 2022 | 24.10 |
| July 31, 2022 | 25.50 |
| June 30, 2022 | 26.70 |
| May 31, 2022 | 27.20 |
| April 30, 2022 | 27.00 |
News
Headline
Time (ET)
07/08 11:52
Basic Info
|
US Milk Farm Price Received is at a current level of 21.30, up from 20.80 last month and down from 21.40 one year ago. This is a change of 2.40% from last month and -0.47% from one year ago. |
| Report | USDA Farm Price Received |
| Category | Agriculture and Livestock |
| Region | United States |
| Source | US Department of Agriculture |
Stats
| Last Value | 21.30 |
| Latest Period | May 2026 |
| Last Updated | Jul 3 2026, 10:01 EDT |
| Next Release | Aug 3 2026, 10:00 EDT (E) |
| Average Growth Rate | 2.37% |
| Value from Last Month | 20.80 |
| Change from Last Month | 2.40% |
| Value from 1 Year Ago | 21.40 |
| Change from 1 Year Ago | -0.47% |
| Frequency | Monthly |
| Unit | USD per Hundred Weight |
| Adjustment | N/A |
| Download Source File | |
| Notes | Monthly average farm price received. |