

US Initial Claims for Unemployment Insurance (I:USICUI)
Level Chart
Basic Info
|
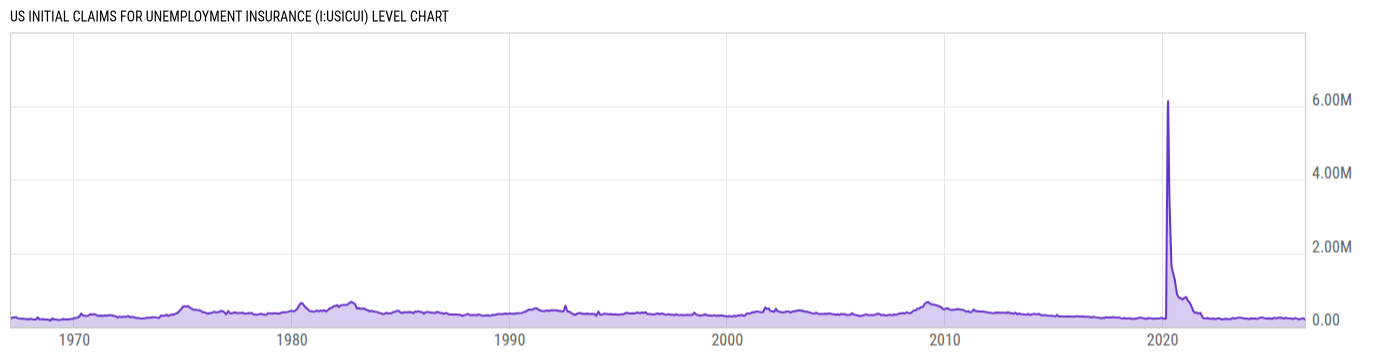
US Initial Claims for Unemployment Insurance is at a current level of 187000.0, down from 209000.0 last week and down from 221000.0 one year ago. This is a change of -10.53% from last week and -15.38% from one year ago. |
|
US Initial Jobless Claims, provided by the US Department of Labor, provides underlying data on how many new people have filed for unemployment benefits in the previous week. Given this, one can gauge market conditions in the US economy with respect to employment; as more new individuals file for unemployment benefits, fewer individuals in the economy have jobs. |
| Report | Unemployment Insurance Weekly Claims |
| Category | Employment |
| Region | United States |
| Source | Department of Labor |
Stats
| Last Value | 187000.0 |
| Latest Period | Jul 18 2026 |
| Last Updated | Jul 23 2026, 08:37 EDT |
| Next Release | Jul 30 2026, 08:30 EDT |
| Average Growth Rate | 19.27% |
| Value from Last Week | 209000.0 |
| Change from Last Week | -10.53% |
| Value from 1 Year Ago | 221000.0 |
| Change from 1 Year Ago | -15.38% |
| Frequency | Weekly |
| Adjustment | Seasonally Adjusted |
Historical Data
| Date | Value |
|---|---|
| July 18, 2026 | 187000.0 |
| July 11, 2026 | 209000.0 |
| July 04, 2026 | 217000.0 |
| June 27, 2026 | 217000.0 |
| June 20, 2026 | 216000.0 |
| June 13, 2026 | 227000.0 |
| June 06, 2026 | 230000.0 |
| May 30, 2026 | 225000.0 |
| May 23, 2026 | 212000.0 |
| May 16, 2026 | 210000.0 |
| May 09, 2026 | 212000.0 |
| May 02, 2026 | 199000.0 |
| April 25, 2026 | 190000.0 |
| April 18, 2026 | 215000.0 |
| April 11, 2026 | 208000.0 |
| April 04, 2026 | 218000.0 |
| March 28, 2026 | 203000.0 |
| March 21, 2026 | 211000.0 |
| March 14, 2026 | 205000.0 |
| March 07, 2026 | 213000.0 |
| February 28, 2026 | 214000.0 |
| February 21, 2026 | 211000.0 |
| February 14, 2026 | 208000.0 |
| February 07, 2026 | 230000.0 |
| January 31, 2026 | 230000.0 |
| Date | Value |
|---|---|
| January 24, 2026 | 211000.0 |
| January 17, 2026 | 210000.0 |
| January 10, 2026 | 201000.0 |
| January 03, 2026 | 207000.0 |
| December 27, 2025 | 203000.0 |
| December 20, 2025 | 215000.0 |
| December 13, 2025 | 224000.0 |
| December 06, 2025 | 235000.0 |
| November 29, 2025 | 216000.0 |
| November 22, 2025 | 218000.0 |
| November 15, 2025 | 222000.0 |
| November 08, 2025 | 228000.0 |
| November 01, 2025 | 228000.0 |
| October 25, 2025 | 221000.0 |
| October 18, 2025 | 231000.0 |
| October 11, 2025 | 222000.0 |
| October 04, 2025 | 233000.0 |
| September 27, 2025 | 225000.0 |
| September 20, 2025 | 219000.0 |
| September 13, 2025 | 233000.0 |
| September 06, 2025 | 259000.0 |
| August 30, 2025 | 236000.0 |
| August 23, 2025 | 229000.0 |
| August 16, 2025 | 233000.0 |
| August 09, 2025 | 224000.0 |
News
Basic Info
|
US Initial Claims for Unemployment Insurance is at a current level of 187000.0, down from 209000.0 last week and down from 221000.0 one year ago. This is a change of -10.53% from last week and -15.38% from one year ago. |
|
US Initial Jobless Claims, provided by the US Department of Labor, provides underlying data on how many new people have filed for unemployment benefits in the previous week. Given this, one can gauge market conditions in the US economy with respect to employment; as more new individuals file for unemployment benefits, fewer individuals in the economy have jobs. |
| Report | Unemployment Insurance Weekly Claims |
| Category | Employment |
| Region | United States |
| Source | Department of Labor |
Stats
| Last Value | 187000.0 |
| Latest Period | Jul 18 2026 |
| Last Updated | Jul 23 2026, 08:37 EDT |
| Next Release | Jul 30 2026, 08:30 EDT |
| Average Growth Rate | 19.27% |
| Value from Last Week | 209000.0 |
| Change from Last Week | -10.53% |
| Value from 1 Year Ago | 221000.0 |
| Change from 1 Year Ago | -15.38% |
| Frequency | Weekly |
| Adjustment | Seasonally Adjusted |
Related Indicators
| US Economy |
| ADP Employment Change | 98000.00 |
| Effective Federal Funds Rate | 3.63% |
| US Durable Goods New Orders MoM | 0.32% |
| US Housing Starts MoM | 19.02% |
| US Imports MoM | 3.27% |
| US Index of Consumer Sentiment | 54.40 |
| US Inflation Rate | 3.50% |
| US ISM Manufacturing PMI | 53.30 |
| US Real GDP QoQ | 2.10% |
| US Retail and Food Services Sales MoM | 0.22% |
| US Unemployment Rate | 4.20% |