

US Durable Goods New Orders (I:USDGNO)
Level Chart
Basic Info
|
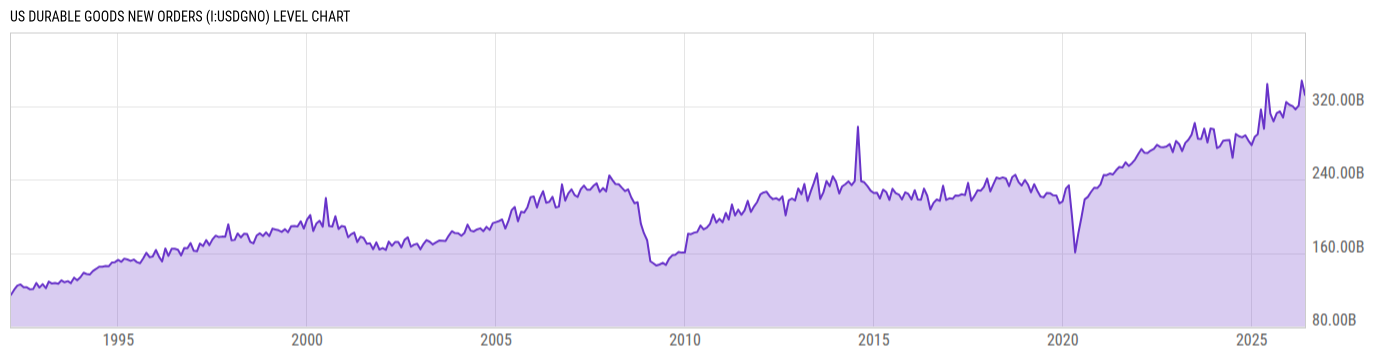
US Durable Goods New Orders is at a current level of 332.05B, down from 347.62B last month and down from 343.98B one year ago. This is a change of -4.48% from last month and -3.47% from one year ago. |
|
US Durable Goods New Orders are the orders placed net of cancellations for manufactured durable goods, where durable goods are defined as products with at least a three-year life expectancy. As a leading indicator in the US, when there is an expectation of improvement or growth in the economy, new orders for manufactured durable goods tend to increase. This is reflected towards the end of the 2008 Financial Crisis where US Durable Goods New Orders saw continued declines, ultimately settling at a trough of $144B in March 2009. |
| Report | Advance Report on Durable Goods |
| Category | Manufacturing Business Statistics |
| Region | United States |
| Source | Census Bureau |
Stats
| Last Value | 332.05B |
| Latest Period | May 2026 |
| Last Updated | Jun 25 2026, 08:33 EDT |
| Next Release | Jul 27 2026, 08:30 EDT |
| Average Growth Rate | 4.27% |
| Value from Last Month | 347.62B |
| Change from Last Month | -4.48% |
| Value from 1 Year Ago | 343.98B |
| Change from 1 Year Ago | -3.47% |
| Frequency | Monthly |
| Unit | USD |
| Adjustment | Seasonally Adjusted |
| Download Source File |
Historical Data
| Date | Value |
|---|---|
| May 31, 2026 | 332.05B |
| April 30, 2026 | 347.62B |
| March 31, 2026 | 320.49B |
| February 28, 2026 | 316.25B |
| January 31, 2026 | 319.88B |
| December 31, 2025 | 321.33B |
| November 30, 2025 | 324.25B |
| October 31, 2025 | 307.41B |
| September 30, 2025 | 314.18B |
| August 31, 2025 | 312.14B |
| July 31, 2025 | 303.20B |
| June 30, 2025 | 311.58B |
| May 31, 2025 | 343.98B |
| April 30, 2025 | 295.26B |
| March 31, 2025 | 316.22B |
| February 28, 2025 | 289.15B |
| January 31, 2025 | 286.60B |
| December 31, 2024 | 277.35B |
| November 30, 2024 | 282.36B |
| October 31, 2024 | 288.13B |
| September 30, 2024 | 285.87B |
| August 31, 2024 | 287.02B |
| July 31, 2024 | 289.59B |
| June 30, 2024 | 263.57B |
| May 31, 2024 | 283.12B |
| Date | Value |
|---|---|
| April 30, 2024 | 282.78B |
| March 31, 2024 | 282.16B |
| February 29, 2024 | 276.11B |
| January 31, 2024 | 274.19B |
| December 31, 2023 | 294.65B |
| November 30, 2023 | 295.50B |
| October 31, 2023 | 280.24B |
| September 30, 2023 | 295.40B |
| August 31, 2023 | 284.03B |
| July 31, 2023 | 284.29B |
| June 30, 2023 | 301.46B |
| May 31, 2023 | 288.86B |
| April 30, 2023 | 283.31B |
| March 31, 2023 | 279.84B |
| February 28, 2023 | 270.82B |
| January 31, 2023 | 278.37B |
| December 31, 2022 | 281.97B |
| November 30, 2022 | 269.78B |
| October 31, 2022 | 278.51B |
| September 30, 2022 | 275.86B |
| August 31, 2022 | 275.06B |
| July 31, 2022 | 275.46B |
| June 30, 2022 | 277.70B |
| May 31, 2022 | 273.37B |
| April 30, 2022 | 271.54B |
News
Basic Info
|
US Durable Goods New Orders is at a current level of 332.05B, down from 347.62B last month and down from 343.98B one year ago. This is a change of -4.48% from last month and -3.47% from one year ago. |
|
US Durable Goods New Orders are the orders placed net of cancellations for manufactured durable goods, where durable goods are defined as products with at least a three-year life expectancy. As a leading indicator in the US, when there is an expectation of improvement or growth in the economy, new orders for manufactured durable goods tend to increase. This is reflected towards the end of the 2008 Financial Crisis where US Durable Goods New Orders saw continued declines, ultimately settling at a trough of $144B in March 2009. |
| Report | Advance Report on Durable Goods |
| Category | Manufacturing Business Statistics |
| Region | United States |
| Source | Census Bureau |
Stats
| Last Value | 332.05B |
| Latest Period | May 2026 |
| Last Updated | Jun 25 2026, 08:33 EDT |
| Next Release | Jul 27 2026, 08:30 EDT |
| Average Growth Rate | 4.27% |
| Value from Last Month | 347.62B |
| Change from Last Month | -4.48% |
| Value from 1 Year Ago | 343.98B |
| Change from 1 Year Ago | -3.47% |
| Frequency | Monthly |
| Unit | USD |
| Adjustment | Seasonally Adjusted |
| Download Source File |
Related Indicators
| US Economy |
| ADP Employment Change | 98000.00 |
| Effective Federal Funds Rate | 3.63% |
| US Durable Goods New Orders MoM | -4.48% |
| US Housing Starts MoM | 19.02% |
| US Imports MoM | 3.27% |
| US Index of Consumer Sentiment | 54.40 |
| US Inflation Rate | 3.50% |
| US Initial Claims for Unemployment Insurance | 187000.0 |
| US ISM Manufacturing PMI | 53.30 |
| US Real GDP QoQ | 2.10% |
| US Retail and Food Services Sales MoM | 0.22% |
| US Unemployment Rate | 4.20% |