

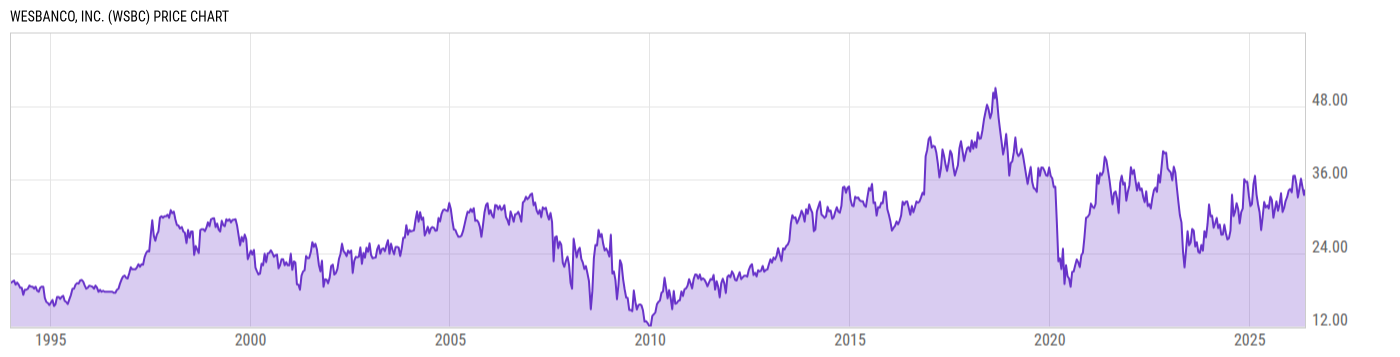
WesBanco, Inc. (WSBC)
36.04
+0.68
(+1.92%)
USD |
NASDAQ |
Jun 09, 09:46
Price Chart
Key Stats
| Price and Performance | |
|---|---|
| Market Cap | 3.465B |
| 52 Week High (Daily) | |
| 52 Week Low (Daily) | |
| All-Time High (Daily) | |
| Year to Date Total Returns (Daily) | |
| 1 Month Total Returns (Daily) | |
| 1 Year Total Returns (Daily) | 19.91% |
| Valuation | |
| PE Ratio | 11.61 |
| PE Ratio (Forward) | |
| PS Ratio | 2.284 |
| Price to Book Value | 0.9008 |
| EV to EBITDA | |
| Dividend | |
|---|---|
| Dividend | 0.38 |
| Dividend Yield (Forward) | |
| Financials | |
| Revenue (5 Year Growth) | |
| Revenue (Quarterly YoY Growth) | |
| EPS Diluted (5 Year Growth) | |
| EPS Diluted (Quarterly YoY Growth) | |
| Debt to Equity Ratio | 0.3434 |
| Return on Equity | |
| Return on Assets | |
| Risk | |
| Beta (5Y) | |
| Max Drawdown (5Y) | 49.67% |
Profile
| WesBanco, Inc. is a bank holding company, which engages in the provision of financial services. It operates through the Community Banking and Trust and Investment Services segments. The Community Banking segment delivers services traditionally offered by service commercial banks, including commercial demand, individual demand, and time deposit accounts, as well as commercial, mortgage, and individual installment loans, and certain non-traditional offerings, such as insurance and securities brokerage services. The Trust and Investment Services segment includes trust services as well as alternative investment products including mutual funds. The company was founded on January 20, 1870 and is headquartered in Wheeling, WV. |
| URL | http://www.wesbanco.com |
| Investor Relations URL | https://investor.wesbanco.com |
| HQ State/Province | West Virginia |
| Sector | Financials |
| Industry | Banks |
| Next Earnings Release | Jul. 28, 2026 (est.) |
| Last Earnings Release | Apr. 21, 2026 |
| Next Ex-Dividend Date | N/A |
| Last Ex-Dividend Date | Jun. 05, 2026 |