

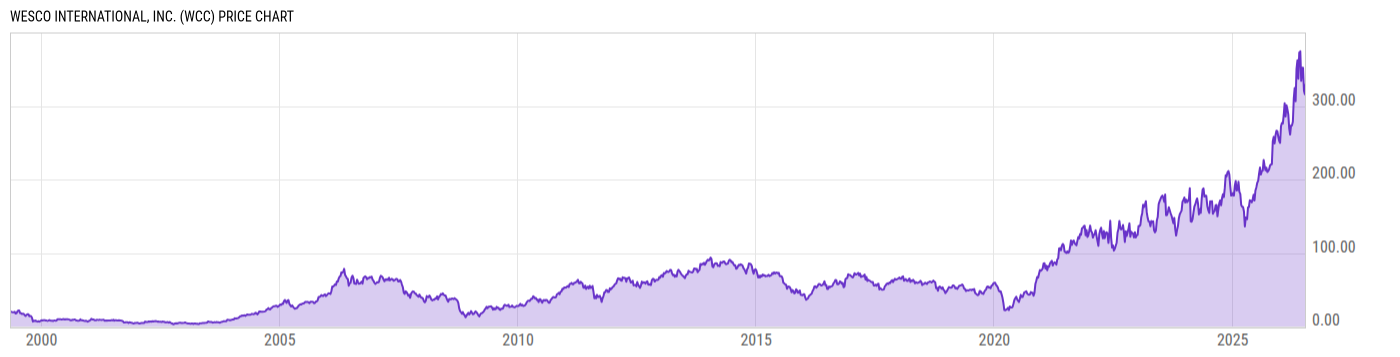
WESCO International, Inc. (WCC)
327.51
+11.36
(+3.59%)
USD |
NYSE |
Jul 09, 15:11
Price Chart
Key Stats
| Price and Performance | |
|---|---|
| Market Cap | 15.95B |
| 52 Week High (Daily) | |
| 52 Week Low (Daily) | |
| All-Time High (Daily) | |
| Year to Date Total Returns (Daily) | |
| 1 Month Total Returns (Daily) | |
| 1 Year Total Returns (Daily) | 62.86% |
| Valuation | |
| PE Ratio | 23.28 |
| PE Ratio (Forward) | |
| PS Ratio | 0.6680 |
| Price to Book Value | 3.126 |
| EV to EBITDA | |
| Dividend | |
|---|---|
| Dividend | 0.50 |
| Dividend Yield (Forward) | |
| Financials | |
| Revenue (5 Year Growth) | |
| Revenue (Quarterly YoY Growth) | |
| EPS Diluted (5 Year Growth) | |
| EPS Diluted (Quarterly YoY Growth) | |
| Debt to Equity Ratio | 1.276 |
| Return on Equity | |
| Return on Assets | |
| Risk | |
| Beta (5Y) | |
| Max Drawdown (5Y) | 37.37% |
Profile
| WESCO International, Inc. engages in providing business-to-business distribution, logistics services, and supply chain solutions. It operates through the following segments: Electrical and Electronic Solutions (EES), Communications and Security Solutions (CSS), and Utility and Broadband Solutions (UBS). The EES segment supplies a broad range of products and supply chain solutions primarily to the construction, industrial, and original equipment manufacturer markets. The CSS segment offers products and customized supply chain solutions to customers in a diverse range of industries, including technology, finance, telecommunications service providers, transportation, education, government, healthcare, and retail. The UBS segment provides electrical transmission and distribution products, power plant maintenance, repair and operations supply, and smart-grid products, and arranges materials management and procurement outsourcing for the power generation, power transmission, and electricity distribution industries. The company was founded in 1993 and is headquartered in Pittsburgh, PA. |
| URL | http://www.wesco.com |
| Investor Relations URL | https://investors.wesco.com/ |
| HQ State/Province | Pennsylvania |
| Sector | Industrials |
| Industry | Trading Companies & Distributors |
| Equity Style | Small Cap Core |
| Next Earnings Release | Jul. 30, 2026 (est.) |
| Last Earnings Release | Apr. 30, 2026 |
| Next Ex-Dividend Date | N/A |
| Last Ex-Dividend Date | Jun. 12, 2026 |