

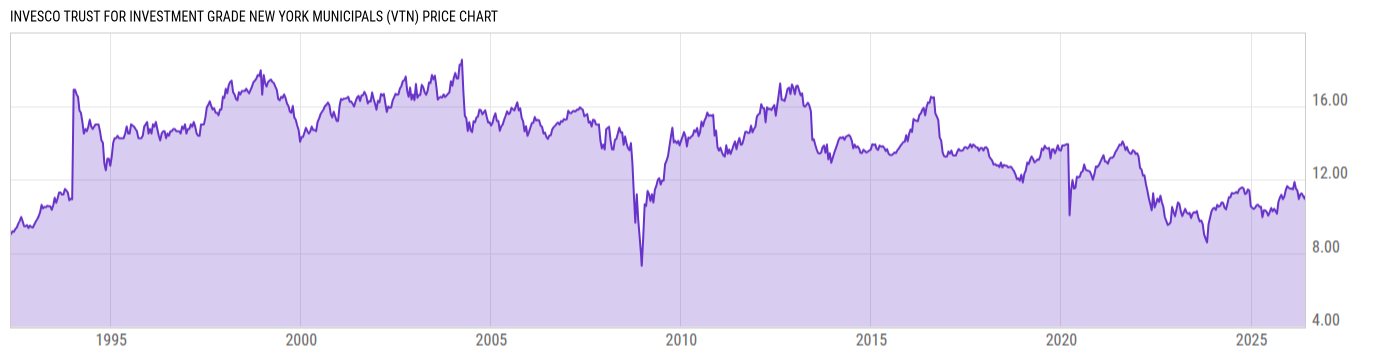
Invesco Trust For Investment Grade New York Municipals (VTN)
11.03
+0.01
(+0.09%)
USD |
NYSE |
Jun 09, 10:31
Price Chart
Key Stats
| Net Expense Ratio | Discount or Premium to NAV | Total Assets Under Management | 30-Day Average Daily Volume |
|---|---|---|---|
| 2.69% | 1.01% | -- | 23957.73 |
| Weighted Average Dividend Yield | Turnover Ratio (Generic) | 1 Year Fund Level Flows | Max Drawdown (Since Inception) |
| -- | 21.00% | -- |
Basic Info
| Investment Strategy | |
| The Fund seeks to provide Common Shareholders with a high level of current income exempt from federal as well as from New York State and New York City income taxes, consistent with preservation of capital. The Fund, under normal market conditions, invests at least 80% of its assets in municipal securities. |
| General | |
| Security Type | Closed-End Fund |
| Equity Style | -- |
| Broad Asset Class | Municipal Bond |
| Broad Category | Fixed Income |
| Global Peer Group | Bond USD Municipal |
| Peer Group | New York Municipal Debt Funds |
| Global Macro | Bond HC |
| US Macro | Single State Municipal Debt Funds |
| YCharts Categorization | -- |
| YCharts Benchmark | -- |
| Prospectus Objective | New York Municipal Debt Funds |
| Fund Owner Firm Name | Invesco |
| Broad Asset Class Benchmark Index | |
| ^BBMBTR | 100.0% |
Performance Versus Peer Group
Annual Total Returns Versus Peers
As of June 09, 2026.
Asset Allocation
As of April 30, 2026.
| Type | % Net |
|---|---|
| Cash | 1.52% |
| Stock | 0.00% |
| Bond | 98.48% |
| Convertible | 0.00% |
| Preferred | 0.00% |
| Other | 0.00% |
Basic Info
| Investment Strategy | |
| The Fund seeks to provide Common Shareholders with a high level of current income exempt from federal as well as from New York State and New York City income taxes, consistent with preservation of capital. The Fund, under normal market conditions, invests at least 80% of its assets in municipal securities. |
| General | |
| Security Type | Closed-End Fund |
| Equity Style | -- |
| Broad Asset Class | Municipal Bond |
| Broad Category | Fixed Income |
| Global Peer Group | Bond USD Municipal |
| Peer Group | New York Municipal Debt Funds |
| Global Macro | Bond HC |
| US Macro | Single State Municipal Debt Funds |
| YCharts Categorization | -- |
| YCharts Benchmark | -- |
| Prospectus Objective | New York Municipal Debt Funds |
| Fund Owner Firm Name | Invesco |
| Broad Asset Class Benchmark Index | |
| ^BBMBTR | 100.0% |