

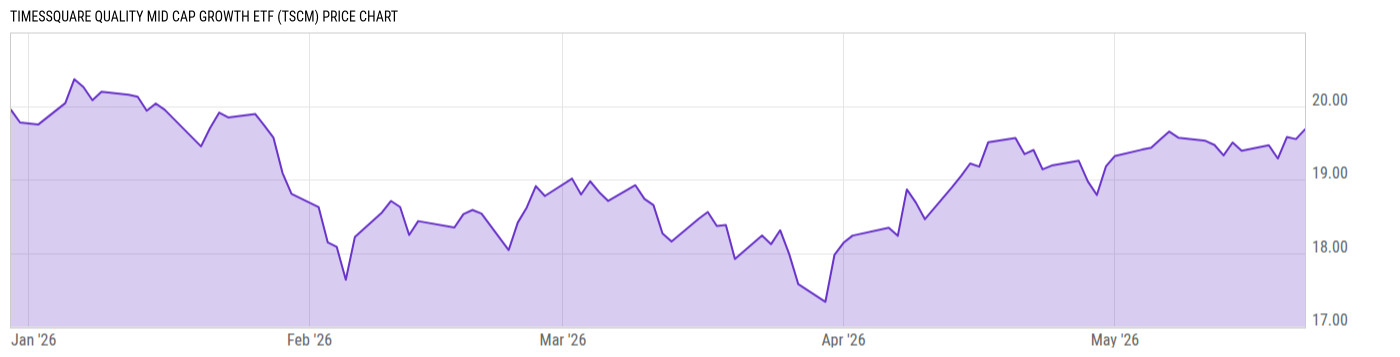
TimesSquare Quality Mid Cap Growth ETF (TSCM)
20.01
-0.60
(-2.91%)
USD |
NASDAQ |
Jun 05, 16:00
Price Chart
Key Stats
| Net Expense Ratio | Discount or Premium to NAV | Total Assets Under Management | 30-Day Average Daily Volume |
|---|---|---|---|
| 0.55% | -0.04% | 43.43M | 1835.37 |
| Weighted Average Dividend Yield | Turnover Ratio (Generic) | 1 Year Fund Level Flows | Max Drawdown (Since Inception) |
| 0.35% | -- | 44.40M |
Basic Info
| Investment Strategy | |
| The Fund seeks long-term capital appreciation and an actively managed ETF. Under normal circumstances, the Fund will invest at least 80% of the value of its net assets, plus any borrowings for investment purposes, in equity securities of mid-capitalization companies that exhibit attributes of a quality growth company. |
| General | |
| Security Type | Exchange-Traded Fund |
| Equity Style | -- |
| Broad Asset Class | US Equity |
| Broad Category | Equity |
| Global Peer Group | Equity US Sm&Mid Cap |
| Peer Group | Mid-Cap Growth Funds |
| Global Macro | Equity North America |
| US Macro | Mid-Cap Funds |
| YCharts Categorization | -- |
| YCharts Benchmark | -- |
| Prospectus Objective | Mid-Cap Funds |
| Fund Owner Firm Name | TimesSquare |
| Broad Asset Class Benchmark Index | |
| ^SPXTR | 100.0% |
Performance Versus Peer Group
Annual Total Returns Versus Peers
As of June 08, 2026.
Asset Allocation
As of February 28, 2026.
| Type | % Net |
|---|---|
| Cash | 0.06% |
| Stock | 99.92% |
| Bond | 0.07% |
| Convertible | 0.00% |
| Preferred | 0.00% |
| Other | -0.05% |
Basic Info
| Investment Strategy | |
| The Fund seeks long-term capital appreciation and an actively managed ETF. Under normal circumstances, the Fund will invest at least 80% of the value of its net assets, plus any borrowings for investment purposes, in equity securities of mid-capitalization companies that exhibit attributes of a quality growth company. |
| General | |
| Security Type | Exchange-Traded Fund |
| Equity Style | -- |
| Broad Asset Class | US Equity |
| Broad Category | Equity |
| Global Peer Group | Equity US Sm&Mid Cap |
| Peer Group | Mid-Cap Growth Funds |
| Global Macro | Equity North America |
| US Macro | Mid-Cap Funds |
| YCharts Categorization | -- |
| YCharts Benchmark | -- |
| Prospectus Objective | Mid-Cap Funds |
| Fund Owner Firm Name | TimesSquare |
| Broad Asset Class Benchmark Index | |
| ^SPXTR | 100.0% |