

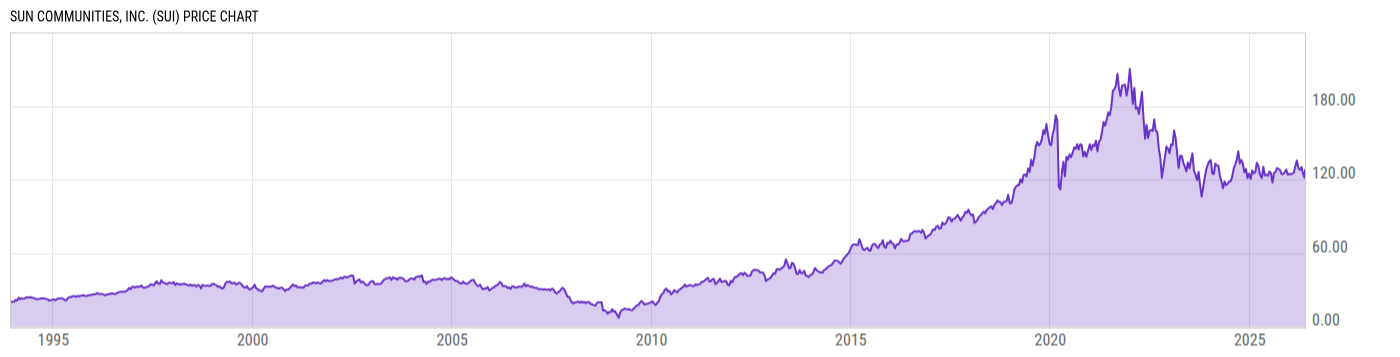
Sun Communities, Inc. (SUI)
124.65
+2.46
(+2.01%)
USD |
NYSE |
Jun 09, 12:16
Price Chart
Key Stats
| Price and Performance | |
|---|---|
| Market Cap | 15.36B |
| 52 Week High (Daily) | |
| 52 Week Low (Daily) | |
| All-Time High (Daily) | |
| Year to Date Total Returns (Daily) | |
| 1 Month Total Returns (Daily) | |
| 1 Year Total Returns (Daily) | 1.53% |
| Valuation | |
| PE Ratio | 11.33 |
| PE Ratio (Forward) | |
| PS Ratio | 6.589 |
| Price to Book Value | 2.275 |
| EV to EBITDA | |
| Dividend | |
|---|---|
| Dividend | 1.12 |
| Dividend Yield (Forward) | |
| Financials | |
| Revenue (5 Year Growth) | |
| Revenue (Quarterly YoY Growth) | |
| EPS Diluted (5 Year Growth) | |
| EPS Diluted (Quarterly YoY Growth) | |
| Debt to Equity Ratio | 0.6355 |
| Return on Equity | |
| Return on Assets | |
| Risk | |
| Beta (5Y) | |
| Max Drawdown (5Y) | 48.72% |
Profile
| Sun Communities, Inc. provides real estate management services. The firm operates through the following segments: Manufactured Home Communities, Recreational Vehicle, and Marina. The Manufactured Home Communities segment owns, operates, and develops manufactured housing communities and is in the business of acquiring, operating, and developing ground up communities to provide housing solutions. The Recreational Vehicle segment focuses on the development of recreational vehicle resorts and is in the business of acquiring, operating and developing ground up resorts throughout the U.S. and in Ontario, Canada. The Marina segment operates marinas and is in the business of acquiring and operating marinas throughout the U.S. The company was founded in 1975 and is headquartered in Southfield, MI. |
| URL | http://www.suncommunities.com |
| Investor Relations URL | https://www.suninc.com/investor-relations |
| HQ State/Province | Michigan |
| Sector | Real Estate |
| Industry | Residential REITs |
| Next Earnings Release | Jul. 29, 2026 (est.) |
| Last Earnings Release | Apr. 27, 2026 |
| Next Ex-Dividend Date | Jun. 30, 2026 |
| Last Ex-Dividend Date | Mar. 31, 2026 |