

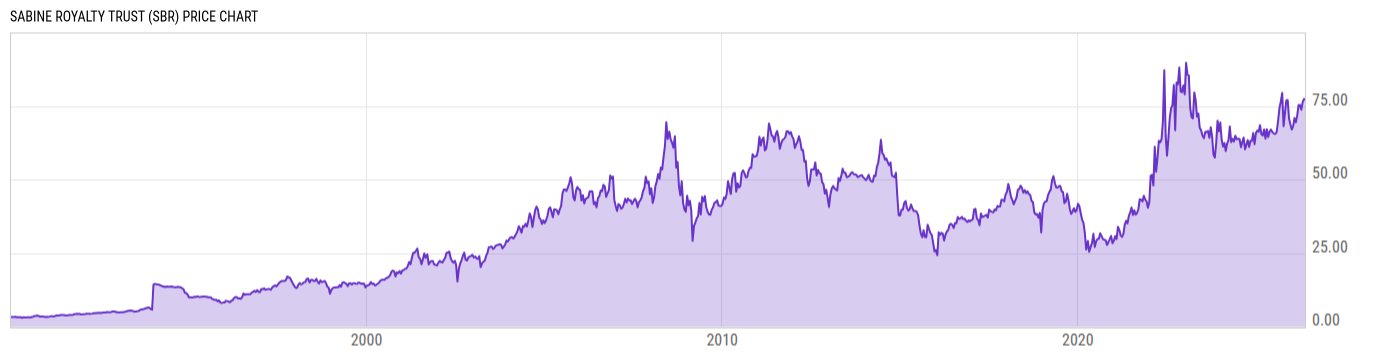
Sabine Royalty Trust (SBR)
78.36
+0.60
(+0.77%)
USD |
NYSE |
Jun 08, 16:00
78.51
+0.15
(+0.19%)
Pre-Market: 20:00
Price Chart
Key Stats
| Price and Performance | |
|---|---|
| Market Cap | 1.142B |
| 52 Week High (Daily) | |
| 52 Week Low (Daily) | |
| All-Time High (Daily) | |
| Year to Date Total Returns (Daily) | |
| 1 Month Total Returns (Daily) | |
| 1 Year Total Returns (Daily) | 24.92% |
| Valuation | |
| PE Ratio | 16.72 |
| PE Ratio (Forward) | |
| PS Ratio | 15.80 |
| Price to Book Value | 165.68 |
| EV to EBITDA | |
| Dividend | |
|---|---|
| Dividend | 0.5030 |
| Dividend Yield (Forward) | |
| Financials | |
| Revenue (5 Year Growth) | |
| Revenue (Quarterly YoY Growth) | |
| EPS Diluted (5 Year Growth) | |
| EPS Diluted (Quarterly YoY Growth) | |
| Debt to Equity Ratio | 0.00 |
| Return on Equity | |
| Return on Assets | |
| Risk | |
| Beta (5Y) | |
| Max Drawdown (5Y) | 34.53% |
Profile
| Sabine Royalty Trust is an express trust, which engages in the provision of Sabine Corporation's royalty and mineral interests. It includes landowner's royalties, overriding royalty interests, minerals, production payments, and any other similar, non-participatory interest, in certain producing, and proved undeveloped oil and gas properties. The company was founded on December 31, 1982 and is headquartered in Dallas, TX. |
| URL | http://www.sbr-sabine.com |
| Investor Relations URL | N/A |
| HQ State/Province | Texas |
| Sector | Energy |
| Industry | Oil, Gas & Consumable Fuels |
| Next Earnings Release | Aug. 07, 2026 (est.) |
| Last Earnings Release | May. 08, 2026 |
| Next Ex-Dividend Date | Jun. 15, 2026 |
| Last Ex-Dividend Date | May. 15, 2026 |