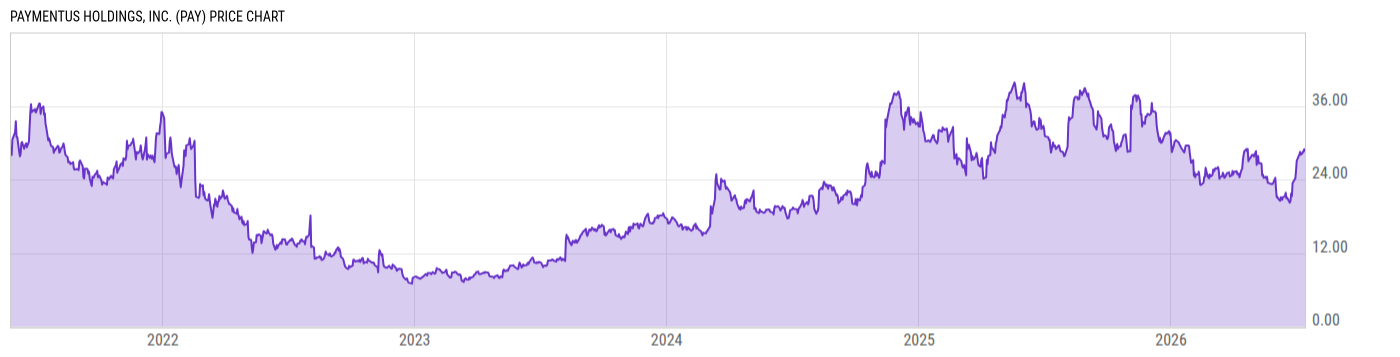
News
| Feb 03 | $PAY measured move target $60 $$ by goingmakai |
| Feb 02 | $PAY support and resistance areas http://stks.co/2DaN by DayTradeNumbers |
| Feb 02 | MasterCard Earnings Rise 27.5%, Beating Estimates, Shares Climb |
| Feb 02 | EXCLUSIVE - Hacked companies still not telling investors |
| Feb 02 | Exclusive: Hacked companies still not telling investors |
| Feb 01 | Trunkbow International Holdings, China's #1 Mobile Payment Software Co. $PAY owns 5%. Nasdaq-TBOW... by morphion |
| Feb 01 | MasterCard Earnings Expected To Charge 24% Higher |
| Feb 01 | $pay monster again by Proptr4d3r |
| Feb 01 | $PAY is a monster $$ by goingmakai |
| Feb 01 | VeriFone to Report First Quarter 2012 Results on March 5, 2012 Business Wire |
Profile
Exchange: NYSE Sector: Consumer Goods Industry: Business Equipment
VeriFone is a global leader in secure electronic payment technologies. It provides solutions, services, and expertise that enable electronic payment transactions and value-added services at the point of sale. The company's devices and systems process a broad spectrum of payment types including signature and PIN-based debit cards, credit cards, EMV smart cards, contactless, value-added applications, and signature capture. It operates through two geographical segments: North America and International. VeriFone Systems was founded in 1981 and is headquartered in San Jose, California. The President and CEO is Douglas G. Bergeron.
1 Year Total Return Performance
This total returns chart shows the returns to an investor from both price appreciation and dividends (dividends are assumed to be reinvested). VeriFone Systems is up N/A over the last year vs S&P 500 Total Return up N/A, MasterCard up N/A, and Diebold up N/A.
- PAY Total Returns
- ^SPXTR Total Returns
- MA Total Returns
- DBD Total Returns
Fundamentals
Fundamental analysis of a business involves analyzing its financial statements and health, its management and competitive advantages. The key financial statements of a company are the income statement, balance sheet and cash flow statement.
Cash Flow Statement View Statement
You may also be interested in these PAY related companies
Pro Strategies Featuring PAY
Did VeriFone Systems make it into our Pro Portfolio Strategies?
PAY Charts
- Accounts Payable
- Accounts Receivable
- Accruals Pro
- Altman Z-Score Pro
- Asset Utilization
- Beneish M-Score Pro
- Beta Pro
- Book Value
- Book Value per Share
- Capital Expenditures
- Cash Conversion Cycle Pro
- Cash Div. Payout Ratio TTM Pro
- Cash Financing
- Cash Financing TTM
- Cash Investing
- Cash Investing TTM
- Cash Operations
- Cash Operations TTM
- Cash and Equivalents
- Cash and ST Investments
- Current Ratio
- Days Inventory Outstanding Pro
- Days Payable Outstanding Pro
- Days Sales Outstanding Pro
- Debt to Equity Ratio
- Dividend
- Dividend Yield
- EBITDA Margin TTM Pro
- EBITDA TTM Pro
- EV / EBIT Pro
- EV / EBITDA Pro
- EV / Free Cash Flow Pro
- EV / Revenues Pro
- Earnings Per Share
- Earnings Per Share Growth
- Earnings Per Share TTM
- Earnings Yield
- Effective Tax Rate TTM Pro
- Enterprise Value
- Expenses
- Expenses TTM
- Free Cash Flow
- Free Cash Flow TTM
- Free Cash Flow Yield Pro
- Fundamental Score Pro
- Gross Profit Margin
- Gross Profit TTM
- Income from Cont. Ops Pro
- Interest Expense
- Interest Income
- Inventories
- KZ Index Pro
- Liabilities
- Long Term Debt
- Market Cap
- Net Income
- Net Income TTM
- Net PP&E
- Operating Earnings Yield Pro
- Operating Margin TTM Pro
- Operating PE Ratio Pro
- Other Comprehensive Income Pro
- PE 10 Pro
- PE Ratio
- PE Value Pro
- PEG Ratio
- PS Value Pro
- Payout Ratio TTM Pro
- Price
- Price / Book Value
- Price / Sales Ratio
- Price / Tangible Book Value Pro
- Profit Margin
- R&D Expense
- Receivables Turnover
- Retained Earnings
- Retained Earnings Growth
- Return on Assets
- Return on Equity
- Return on Invested Capital Pro
- Revenue Growth
- Revenue Per Share TTM
- Revenues
- Revenues TTM
- SG&A Expense
- Shareholders Equity
- Shares Outstanding
- Stock Buybacks
- Tangible Book Value Pro
- Tangible Book Value Per Share Pro
- Tangible Common Equity Ratio Pro
- Times Interest Earned TTM Pro
- Total Assets
- Total Return Price
- Valuation (Historical Mult.) Pro
- Valuation Percentage Pro
- Value Score Pro
Other PAY Resources
- Company Website
- Wiki Page
- Investor Relations
- 13F Filings Whale Wisdom
- Call Transcripts Seeking Alpha
- Insider Trading Quote.com
- Institutional Ownership MSN Money
- SEC Filings SEC
- Technical Charts Chart.ly
- Trading Ideas Benzinga
Recent Quotes
| Symbol | Price | Chg | Chg % | Market Cap |
|---|---|---|---|---|
| PAY | 46.25 | 1.14 | 2.53% | 4.87B |
| APOL | 52.41 | 0.25 | 0.48% | 6.82B |
| NETL | 49.80 | 0.00 | 0.00% | 3.45B |
| USG | 15.16 | 1.14 | 8.13% | 1.60B |
| MDR | 13.65 | 0.51 | 3.88% | 3.20B |
| XLV | 36.22 | 0.21 | 0.58% | |
| PRGO | 93.66 | 0.53 | 0.57% | 8.73B |
| LUV | 10.04 | 0.29 | 2.97% | 7.82B |
| EGO | 14.76 | -0.74 | -4.77% | 8.13B |
| TM | 76.47 | 0.24 | 0.31% | 119.89B |