

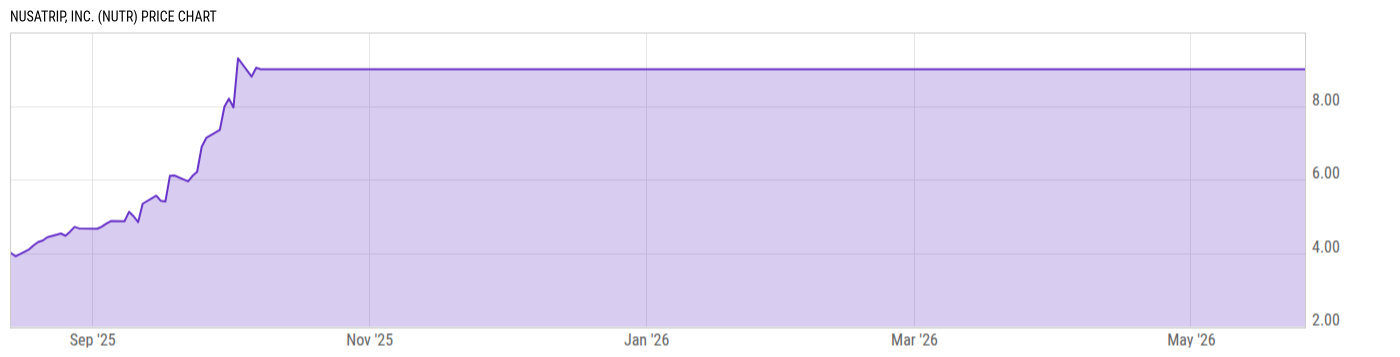
NusaTrip, Inc. (NUTR)
9.00
0.00 (0.00%)
USD |
NASDAQ |
May 26, 16:00
Price Chart
Key Stats
| Price and Performance | |
|---|---|
| Market Cap | 174.41M |
| 52 Week High (Daily) | |
| 52 Week Low (Daily) | |
| All-Time High (Daily) | |
| Year to Date Total Returns (Daily) | |
| 1 Month Total Returns (Daily) | |
| 1 Year Total Returns (Daily) | -- |
| Valuation | |
| PE Ratio | -- |
| PE Ratio (Forward) | |
| PS Ratio | 72.95 |
| Price to Book Value | 13.95 |
| EV to EBITDA | |
| Dividend | |
|---|---|
| Dividend | -- |
| Dividend Yield (Forward) | |
| Financials | |
| Revenue (5 Year Growth) | |
| Revenue (Quarterly YoY Growth) | |
| EPS Diluted (5 Year Growth) | |
| EPS Diluted (Quarterly YoY Growth) | |
| Debt to Equity Ratio | 0.0164 |
| Return on Equity | |
| Return on Assets | |
| Risk | |
| Beta (5Y) | |
| Max Drawdown (5Y) | -- |
Profile
| NusaTrip, Inc. is an online travel agency, which engages in the provision of online travel and hotel ticket bookings. The firm also offers a one-stop platform where travelers can search, compare, and book flights, hotels, car rentals, and other travel-related services. It operates through the following segments: Ticketing, Online Advertisement, Hotel Reservation, Hotel Technology Platform Software, and Ancillary. The company was founded in 2013 and is headquartered in Jakarta, Indonesia. |
| URL | http://www.nusatrip.com |
| Investor Relations URL | N/A |
| HQ State/Province | Jakarta Raya |
| Sector | Consumer Discretionary |
| Industry | Hotels, Restaurants & Leisure |
| Next Earnings Release | N/A |
| Last Earnings Release | N/A |
| Next Ex-Dividend Date | N/A |
| Last Ex-Dividend Date | N/A |