

Nokia Oyj (NOK)
Key Stats
A rich library of individual company data, all in a single view and exportable directly to Excel.
Inside-and-Out Company Data
The Key Stats Tab includes key company line items from the Income Statement, Balance Sheet, and Statement of Cash Flows. But that’s just the beginning; Key Stats include performance, risk, valuation, earnings estimates, dividend info, and even speciality data such as management effectiveness and a slew of advanced metrics.
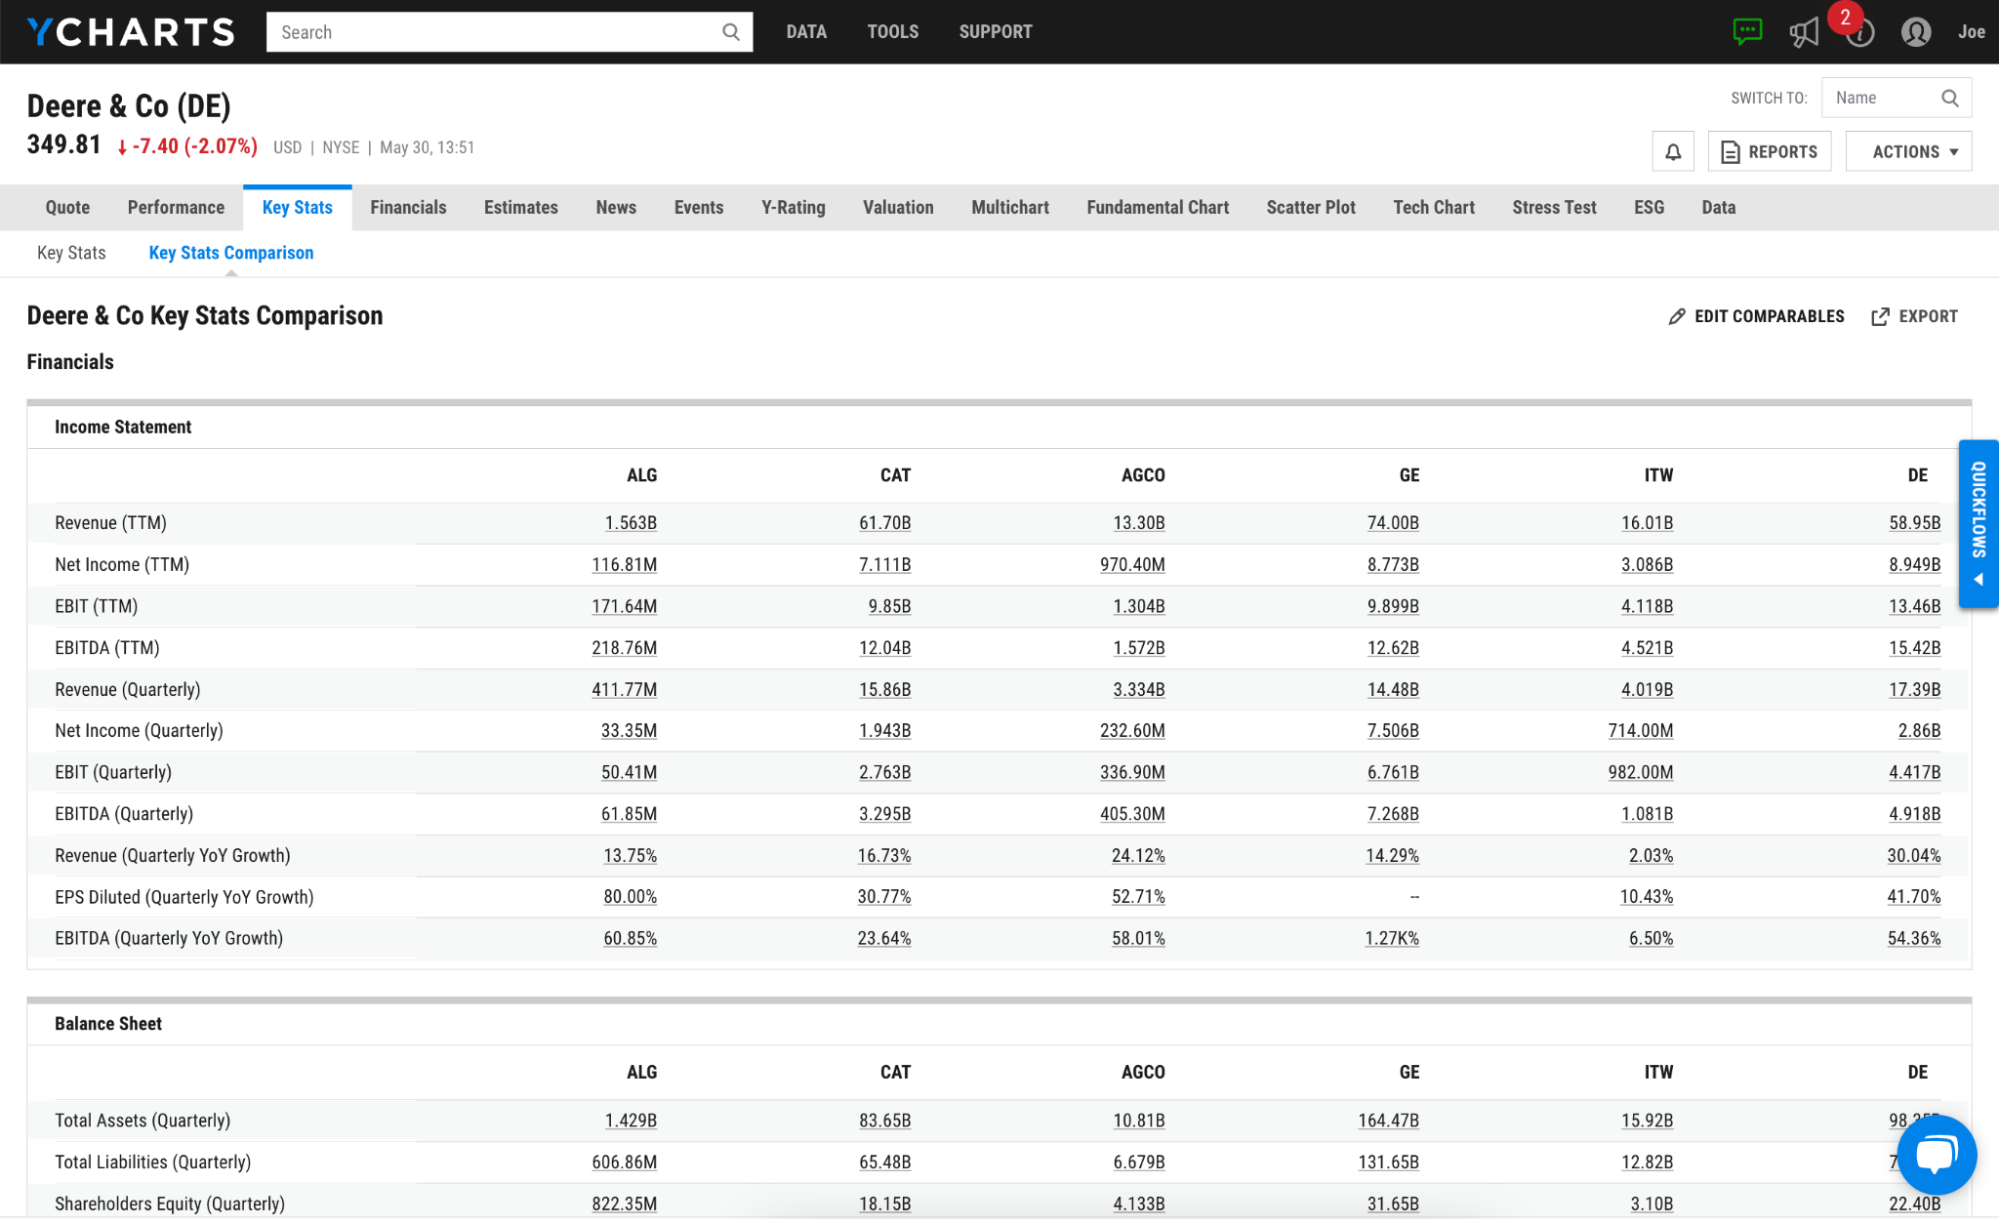
Understand the Industry Better with Key Stats Comparison
Clicking on “Key Stats Comparison” populates company data for your selected company plus up to five others of your choosing. Data is presented with a look and feel of a company’s 10-K statement for easy comparison and analysis.
Export Data with a Single Click
Key Stats data can be exported into .XLS files, great for continuing your analysis in Microsoft Excel.
QUESTIONS?
- Email: support@ycharts.com
- Call: (866) 965-7552
READY TO GET STARTED?
Unlock My AccessAccess Key Stats Now
Unlock access to Key Stats by registering below. No credit card required.
Unlock My AccessQUESTIONS?
- Email: support@ycharts.com
- Call: (866) 965-7552