

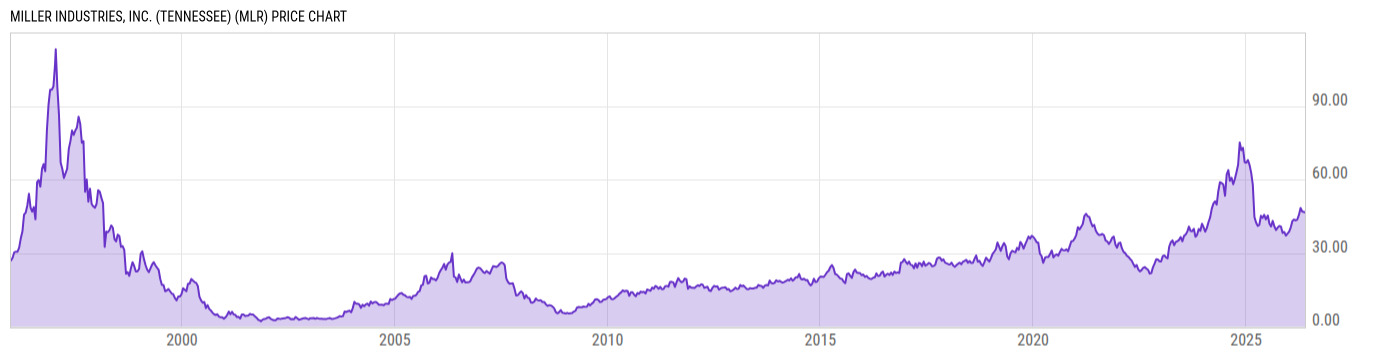
Miller Industries, Inc. (Tennessee) (MLR)
49.33
+1.46
(+3.05%)
USD |
NYSE |
Jun 09, 09:46
Price Chart
Key Stats
| Price and Performance | |
|---|---|
| Market Cap | 562.15M |
| 52 Week High (Daily) | |
| 52 Week Low (Daily) | |
| All-Time High (Daily) | |
| Year to Date Total Returns (Daily) | |
| 1 Month Total Returns (Daily) | |
| 1 Year Total Returns (Daily) | 7.03% |
| Valuation | |
| PE Ratio | 36.88 |
| PE Ratio (Forward) | |
| PS Ratio | 0.7659 |
| Price to Book Value | 1.347 |
| EV to EBITDA | |
| Dividend | |
|---|---|
| Dividend | 0.21 |
| Dividend Yield (Forward) | |
| Financials | |
| Revenue (5 Year Growth) | |
| Revenue (Quarterly YoY Growth) | |
| EPS Diluted (5 Year Growth) | |
| EPS Diluted (Quarterly YoY Growth) | |
| Debt to Equity Ratio | 0.0599 |
| Return on Equity | |
| Return on Assets | |
| Risk | |
| Beta (5Y) | |
| Max Drawdown (5Y) | 53.25% |
Profile
| Miller Industries, Inc. (Tennessee) engages in the manufacture of vehicle towing and recovery equipment. Its products include car carriers, light duty, heavy duty, rotators, and special transport. The firm markets its products under the brand names of Century, Challenger, Holmes, Champion, Eagle, Titan, Jige, Boniface, Vulcan, and Chevron. The company was founded by William G. Miller in 1990 and is headquartered in Ooltewah, TN. |
| URL | http://www.millerind.com |
| Investor Relations URL | https://www.millerind.com/investors?/investor-relations |
| HQ State/Province | Tennessee |
| Sector | Industrials |
| Industry | Machinery |
| Next Earnings Release | Aug. 05, 2026 (est.) |
| Last Earnings Release | May. 06, 2026 |
| Next Ex-Dividend Date | N/A |
| Last Ex-Dividend Date | Jun. 01, 2026 |