

GSI Technology, Inc. (GSIT)
8.07
+0.06
(+0.69%)
USD |
NASDAQ |
Jun 09, 09:44
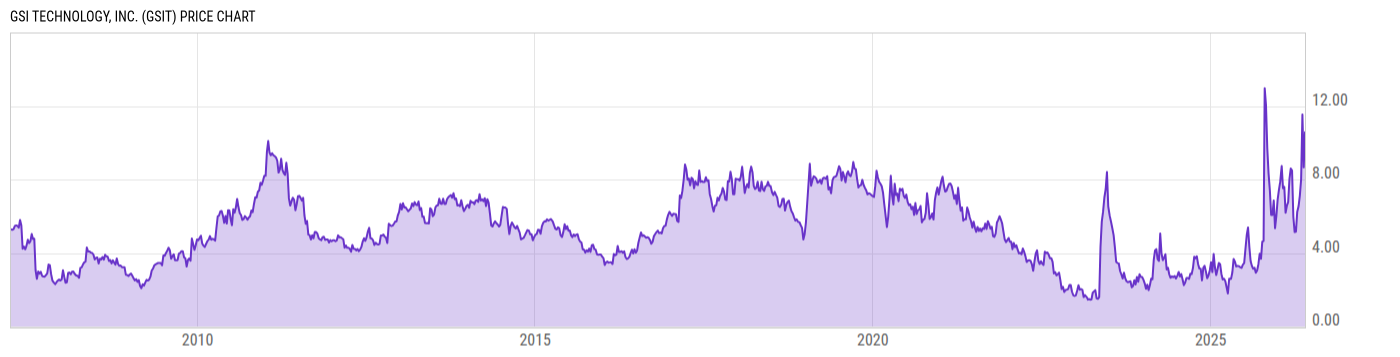
Price Chart
Key Stats
| Price and Performance | |
|---|---|
| Market Cap | 295.38M |
| 52 Week High (Daily) | |
| 52 Week Low (Daily) | |
| All-Time High (Daily) | |
| Year to Date Total Returns (Daily) | |
| 1 Month Total Returns (Daily) | |
| 1 Year Total Returns (Daily) | 138.5% |
| Valuation | |
| PE Ratio | -- |
| PE Ratio (Forward) | |
| PS Ratio | 10.23 |
| Price to Book Value | 3.613 |
| EV to EBITDA | |
| Dividend | |
|---|---|
| Dividend | -- |
| Dividend Yield (Forward) | |
| Financials | |
| Revenue (5 Year Growth) | |
| Revenue (Quarterly YoY Growth) | |
| EPS Diluted (5 Year Growth) | |
| EPS Diluted (Quarterly YoY Growth) | |
| Debt to Equity Ratio | 0.1035 |
| Return on Equity | |
| Return on Assets | |
| Risk | |
| Beta (5Y) | |
| Max Drawdown (5Y) | 83.69% |
Profile
| GSI Technology, Inc. engages in the design, development and marketing of memory products primarily for the networking, and telecommunications markets. Its product includes Static Random Access Memory, or SRAM, which incorporated in networking and telecommunications equipment, such as routers, switches, wide area network infrastructure equipment, wireless base stations and network access equipment. It also offers services to the ongoing needs of the military, industrial, test and measurement equipment, automotive and medical markets for SRAMs .The company was founded by Lee-Lean Shu and Robert Yau in March 1995 and is headquartered in Sunnyvale, CA. |
| URL | http://www.gsitechnology.com |
| Investor Relations URL | https://ir.gsitechnology.com/ |
| HQ State/Province | California |
| Sector | Information Technology |
| Industry | Semiconductors & Semiconductor Equipment |
| Next Earnings Release | Jul. 30, 2026 (est.) |
| Last Earnings Release | May. 07, 2026 |
| Next Ex-Dividend Date | N/A |
| Last Ex-Dividend Date | N/A |