

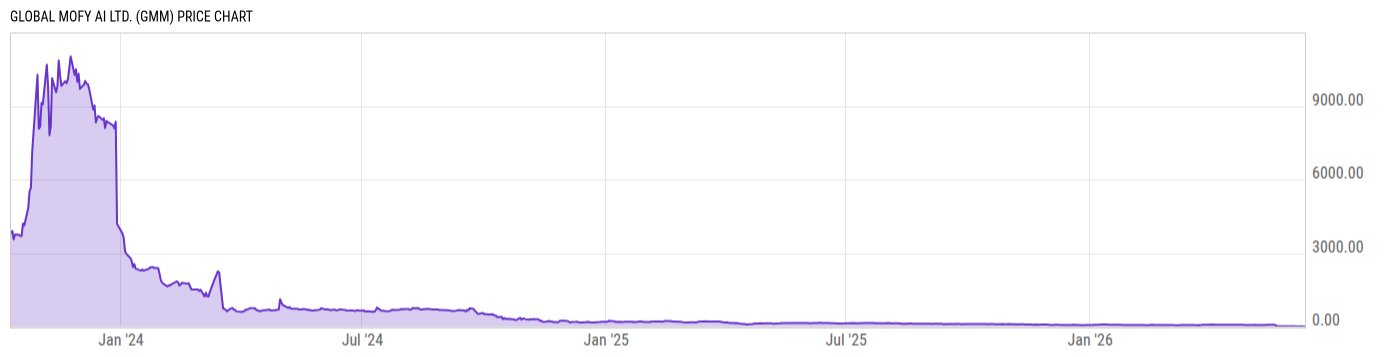
Global Mofy AI Ltd. (GMM)
0.0904
+0.01
(+11.19%)
USD |
NASDAQ |
Jun 08, 16:00
0.0874
0.00 (0.00%)
After-Hours: 05:18
Price Chart
Key Stats
| Price and Performance | |
|---|---|
| Market Cap | -- |
| 52 Week High (Daily) | |
| 52 Week Low (Daily) | |
| All-Time High (Daily) | |
| Year to Date Total Returns (Daily) | |
| 1 Month Total Returns (Daily) | |
| 1 Year Total Returns (Daily) | -96.79% |
| Valuation | |
| PE Ratio | -- |
| PE Ratio (Forward) | |
| PS Ratio | 0.0286 |
| Price to Book Value | -- |
| EV to EBITDA | |
| Dividend | |
|---|---|
| Dividend | -- |
| Dividend Yield (Forward) | |
| Financials | |
| Revenue (5 Year Growth) | |
| Revenue (Quarterly YoY Growth) | |
| EPS Diluted (5 Year Growth) | |
| EPS Diluted (Quarterly YoY Growth) | |
| Debt to Equity Ratio | -- |
| Return on Equity | |
| Return on Assets | |
| Risk | |
| Beta (5Y) | |
| Max Drawdown (5Y) | -- |
Profile
| Global Mofy AI Ltd. is a holding company, which engages in AI-Driven technology solutions provider engaged in virtual content production, and digital assets development for the digital content industry. The firm utilizes its “Mofy Lab” technology platform, which consists of 3D rebuilt technology AI interactive technology. It creates virtual versions of a range of physical world objects, such as humans, animals, and scenes. The company was founded by Hao Gang Yang on September 29, 2021 and is headquartered in Beijing, China. |
| URL | http://ir.globalmofy.cn |
| Investor Relations URL | https://ir.globalmofy.cn/index.html |
| HQ State/Province | Beijing |
| Sector | Communication Services |
| Industry | Entertainment |
| Next Earnings Release | N/A |
| Last Earnings Release | N/A |
| Next Ex-Dividend Date | N/A |
| Last Ex-Dividend Date | N/A |