

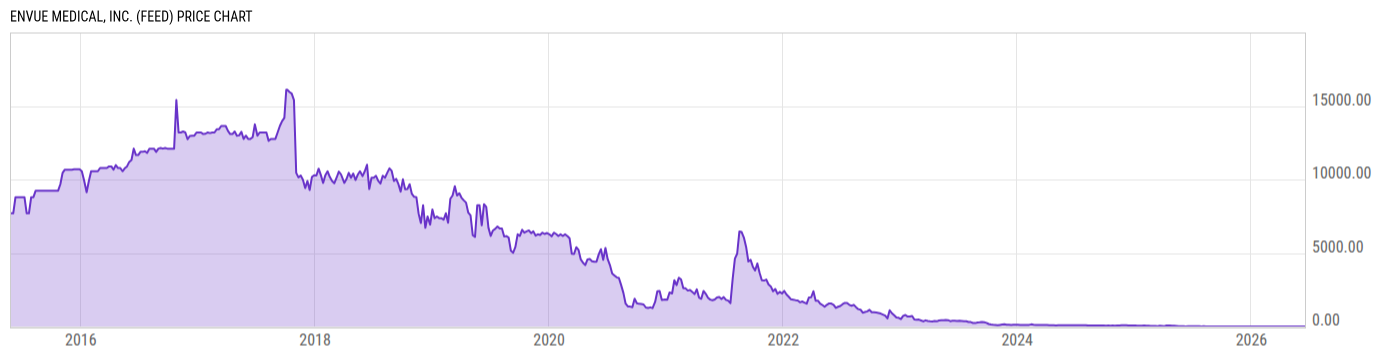
ENvue Medical, Inc. (FEED)
0.799
-0.07
(-8.06%)
USD |
NASDAQ |
Jun 08, 16:00
0.7938
-0.01
(-0.65%)
After-Hours: 20:00
Price Chart
Key Stats
| Price and Performance | |
|---|---|
| Market Cap | 2.957M |
| 52 Week High (Daily) | |
| 52 Week Low (Daily) | |
| All-Time High (Daily) | |
| Year to Date Total Returns (Daily) | |
| 1 Month Total Returns (Daily) | |
| 1 Year Total Returns (Daily) | -90.95% |
| Valuation | |
| PE Ratio | -- |
| PE Ratio (Forward) | |
| PS Ratio | 0.4851 |
| Price to Book Value | 0.0924 |
| EV to EBITDA | |
| Dividend | |
|---|---|
| Dividend | -- |
| Dividend Yield (Forward) | |
| Financials | |
| Revenue (5 Year Growth) | |
| Revenue (Quarterly YoY Growth) | |
| EPS Diluted (5 Year Growth) | |
| EPS Diluted (Quarterly YoY Growth) | |
| Debt to Equity Ratio | 0.0378 |
| Return on Equity | |
| Return on Assets | |
| Risk | |
| Beta (5Y) | |
| Max Drawdown (5Y) | 99.99% |
Profile
| ENvue Medical, Inc. engages in the development of noninvasive biological response-activating devices. The firm's products include UroShield and PainShield. It operates through NanoVibronix and ENvue segments. The company was founded by Harold Jacob and Jona Zumeris in September 2003 and is headquartered in Tyler, TX. |
| URL | http://envuemed.com |
| Investor Relations URL | N/A |
| HQ State/Province | Texas |
| Sector | Health Care |
| Industry | Health Care Equipment & Supplies |
| Next Earnings Release | N/A |
| Last Earnings Release | N/A |
| Next Ex-Dividend Date | N/A |
| Last Ex-Dividend Date | N/A |