

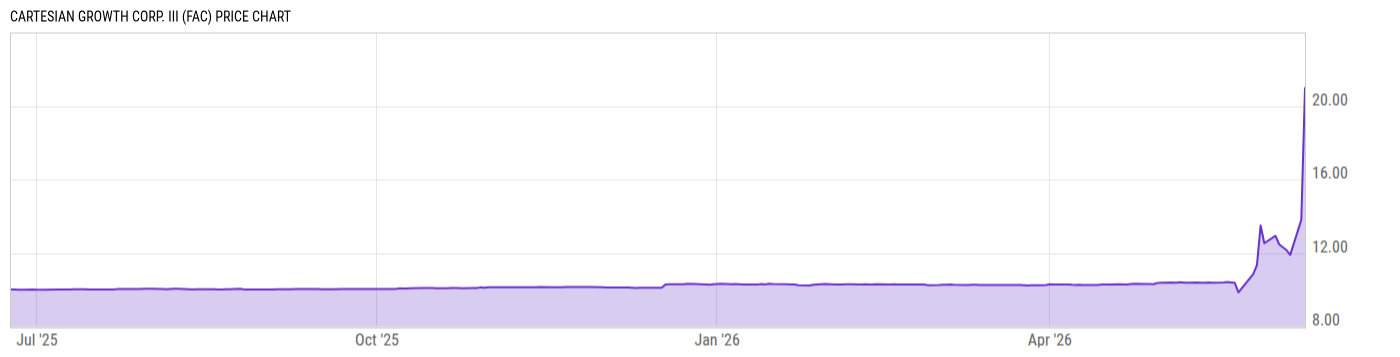
Cartesian Growth Corp. III (FAC)
20.98
+7.18
(+52.03%)
USD |
NASDAQ |
Jun 09, 09:41
Price Chart
Key Stats
| Price and Performance | |
|---|---|
| Market Cap | 723.81M |
| 52 Week High (Daily) | |
| 52 Week Low (Daily) | |
| All-Time High (Daily) | |
| Year to Date Total Returns (Daily) | |
| 1 Month Total Returns (Daily) | |
| 1 Year Total Returns (Daily) | -- |
| Valuation | |
| PE Ratio | 91.42 |
| PE Ratio (Forward) | |
| PS Ratio | -- |
| Price to Book Value | 2.662 |
| EV to EBITDA | |
| Dividend | |
|---|---|
| Dividend | -- |
| Dividend Yield (Forward) | |
| Financials | |
| Revenue (5 Year Growth) | |
| Revenue (Quarterly YoY Growth) | |
| EPS Diluted (5 Year Growth) | |
| EPS Diluted (Quarterly YoY Growth) | |
| Debt to Equity Ratio | 0.00 |
| Return on Equity | |
| Return on Assets | |
| Risk | |
| Beta (5Y) | |
| Max Drawdown (5Y) | -- |
Profile
| Cartesian Growth Corp. III is a blank check company. It was created for the purpose of effecting a merger, amalgamation, share exchange, asset acquisition, share purchase, reorganization or similar business combination. The company was founded on October 29, 2024 and is headquartered in New York, NY. |
| URL | http://www.cartesiangrowth.com/cgc3 |
| Investor Relations URL | https://www.cartesiangrowth.com/cgc1/investor-relations |
| HQ State/Province | New York |
| Sector | |
| Industry | |
| Next Earnings Release | N/A |
| Last Earnings Release | N/A |
| Next Ex-Dividend Date | N/A |
| Last Ex-Dividend Date | N/A |