

Dole Plc (DOLE)
14.12
+0.02
(+0.14%)
USD |
NYSE |
Jul 15, 14:50
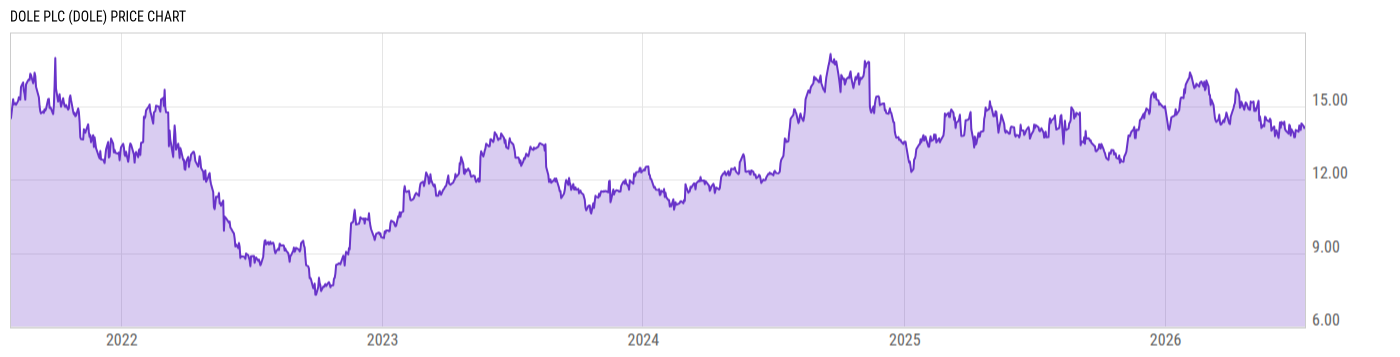
Price Chart
Key Stats
| Price and Performance | |
|---|---|
| Market Cap | 1.344B |
| 52 Week High (Daily) | |
| 52 Week Low (Daily) | |
| All-Time High (Daily) | |
| Year to Date Total Returns (Daily) | |
| 1 Month Total Returns (Daily) | |
| 1 Year Total Returns (Daily) | 3.74% |
| Valuation | |
| PE Ratio | 23.18 |
| PE Ratio (Forward) | |
| PS Ratio | 0.1435 |
| Price to Book Value | 0.9765 |
| EV to EBITDA | |
| Dividend | |
|---|---|
| Dividend | 0.085 |
| Dividend Yield (Forward) | |
| Financials | |
| Revenue (5 Year Growth) | |
| Revenue (Quarterly YoY Growth) | |
| EPS Diluted (5 Year Growth) | |
| EPS Diluted (Quarterly YoY Growth) | |
| Debt to Equity Ratio | 0.9694 |
| Return on Equity | |
| Return on Assets | |
| Risk | |
| Beta (5Y) | |
| Max Drawdown (5Y) | -- |
Profile
| Dole Plc engages in the distribution and marketing of fresh fruits and vegetables. It operates through the following segments: Fresh Fruit, Diversified Fresh Produce–EMEA, Diversified Fresh Produce–Americas and ROW, and Fresh Vegetables. The Fresh Fruit segment sells bananas and pineapples which are sourced from local growers or Dole-owned and leased farms, predominately located in Latin America, and sold throughout North America, Europe, Latin America, and Asia. The Diversified Fresh Produce–EMEA segment includes Dole’s Irish, Dutch, Spanish, Portuguese, French, Italian, U.K., Swedish, Danish, South African, Eastern European and Brazilian businesses, the majority of which sell a variety of imported and local fresh fruits and vegetables through retail, wholesale and, in some instances, food service channels across the European marketplace. The Diversified Fresh Produce – Americas and ROW segment refers to Dole’s U.S., Canadian, Chilean, Peruvian, Argentinian and Indian businesses, all which market globally and locally-sourced fresh produce from third-party growers or Dole-owned farms through retail, wholesale, and food service channels. The Fresh Vegetables segment is involved in the operations related to the sale of value-added salads, which include salad and meal kits, and fresh-packed vegetables, which include produce such as iceberg, romaine, leaf lettuces, and celery. The company was founded on June 16, 2017, and is headquartered in Dublin, Ireland. |
| URL | http://www.doleplc.com |
| Investor Relations URL | https://www.doleplc.com/investor-relations/overview/default.aspx |
| HQ State/Province | Dublin |
| Sector | Consumer Staples |
| Industry | Food Products |
| Equity Style | Small Cap Value |
| Next Earnings Release | Aug. 10, 2026 (est.) |
| Last Earnings Release | May. 11, 2026 |
| Next Ex-Dividend Date | N/A |
| Last Ex-Dividend Date | Jun. 17, 2026 |