

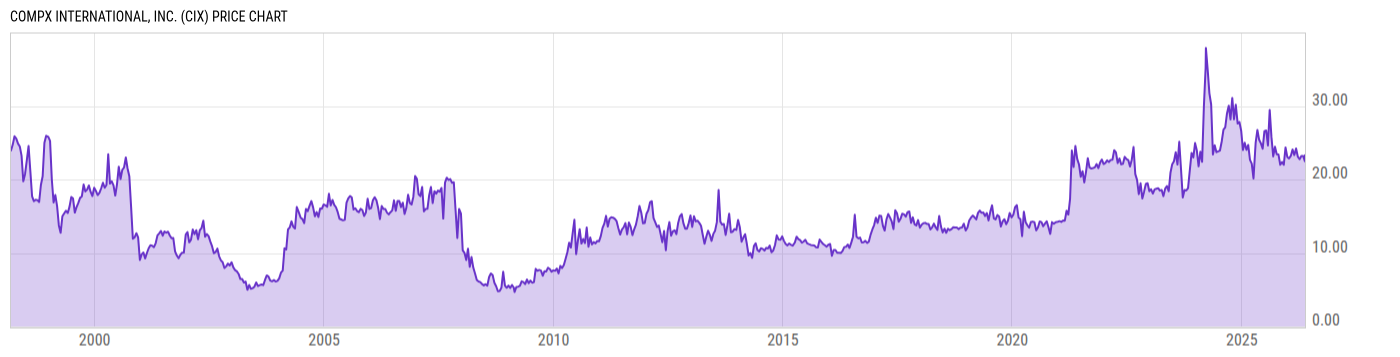
CompX International, Inc. (CIX)
24.83
+0.59
(+2.43%)
USD |
NYAM |
Jun 08, 16:00
24.83
0.00 (0.00%)
After-Hours: 20:00
Price Chart
Key Stats
| Price and Performance | |
|---|---|
| Market Cap | 305.98M |
| 52 Week High (Daily) | |
| 52 Week Low (Daily) | |
| All-Time High (Daily) | |
| Year to Date Total Returns (Daily) | |
| 1 Month Total Returns (Daily) | |
| 1 Year Total Returns (Daily) | 11.90% |
| Valuation | |
| PE Ratio | 15.15 |
| PE Ratio (Forward) | |
| PS Ratio | 1.929 |
| Price to Book Value | 2.173 |
| EV to EBITDA | |
| Dividend | |
|---|---|
| Dividend | 0.30 |
| Dividend Yield (Forward) | |
| Financials | |
| Revenue (5 Year Growth) | |
| Revenue (Quarterly YoY Growth) | |
| EPS Diluted (5 Year Growth) | |
| EPS Diluted (Quarterly YoY Growth) | |
| Debt to Equity Ratio | 0.0072 |
| Return on Equity | |
| Return on Assets | |
| Risk | |
| Beta (5Y) | |
| Max Drawdown (5Y) | 43.85% |
Profile
| CompX International, Inc. engages in the manufacture of security products used in the recreational transportation, postal, office and institutional furniture, cabinetry, tool storage, healthcare, and a variety of other industries. It operates through the Security Products and Marine Components segments. The Security Products segment manufactures mechanical and electronic cabinet locks and other locking mechanisms used in a variety of applications including ignition systems, mailboxes, file cabinets, desk drawers, tool storage cabinets, vending and gaming machines, high security medical cabinetry, electronic circuit panels, storage compartments, and gas station security. The Marine Components segment manufactures and distributes stainless steel exhaust components, gauges, throttle controls, trim tabs, hardware, and accessories primarily for performance and ski and wakeboard boats. The company was founded in 1993 and is headquartered in Dallas, TX. |
| URL | http://www.compxinternational.com |
| Investor Relations URL | https://compxinternational.com/investors |
| HQ State/Province | Texas |
| Sector | Industrials |
| Industry | Commercial Services & Supplies |
| Next Earnings Release | Aug. 04, 2026 (est.) |
| Last Earnings Release | May. 05, 2026 |
| Next Ex-Dividend Date | N/A |
| Last Ex-Dividend Date | Jun. 04, 2026 |