

The Carlyle Group Inc (CG)
Fundamental Chart
Choose from thousands of securities and metrics to create insightful and comprehensive visuals, add your firm’s logo for marketing distribution, and share your knowledge with clients and prospects.
Tell a Compelling Story Using Stunning Visuals
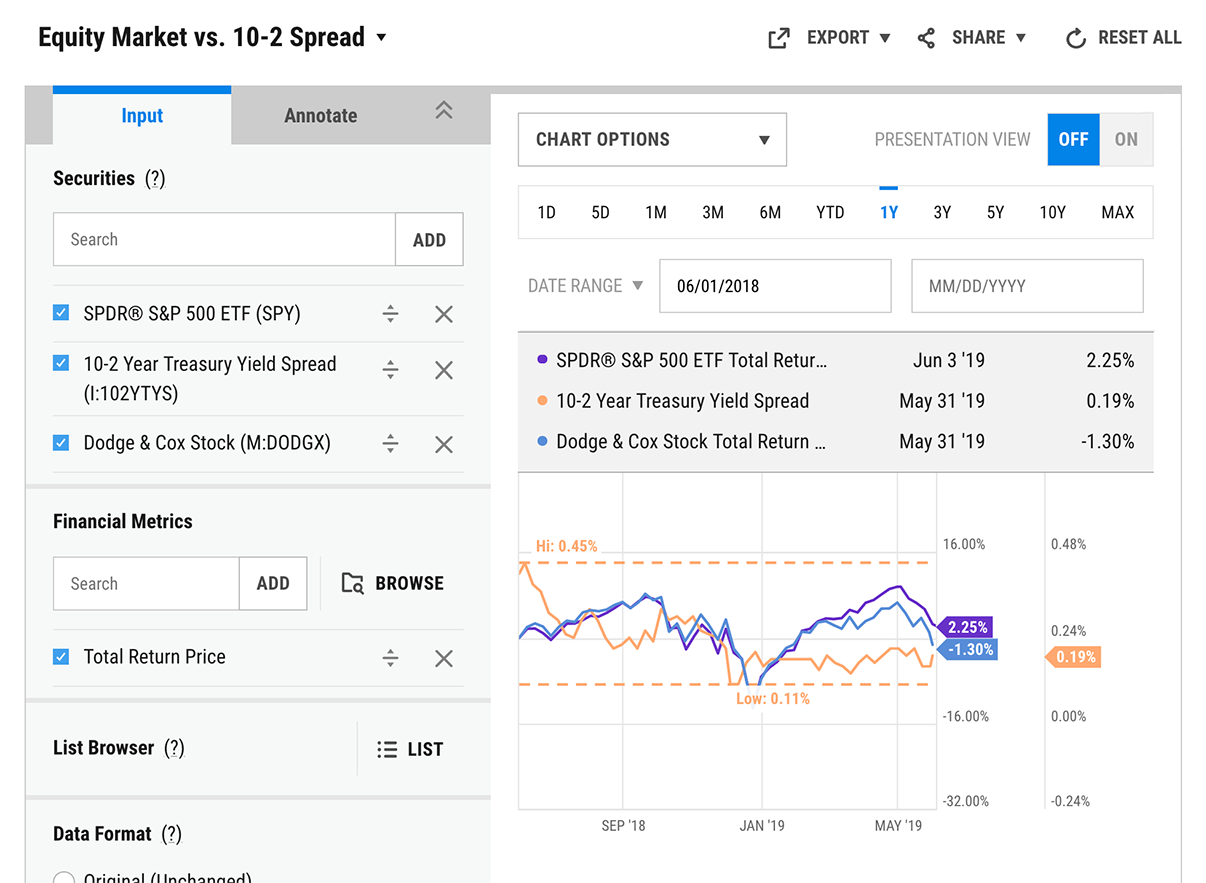
Go beyond price to chart the fundamental levers that impact performance. YCharts enables the comparison of multiple securities based on virtually any performance metric or valuation ratio — plus, layer in macroeconomic indicators to show the “why” behind a security’s performance.
Access Large Quantities of Quality Data
We source data from Morningstar and S&P Global in addition to mining our own economic indicators and events data. Fundamental Charts can be built off of more than 4,000 metrics and line items, covering 20,000+ securities and 400,000+ economic indicators such as labor statistics, GDP, and more.
Share your Research to Promote your Brand
Fundamental Charts are brandable with your firm’s logo enabling you to own your research and create additional touch points with prospects and clients. With a simple click, Fundamental Charts can be shared with colleagues, downloaded as images, embedded into emails or blogs, or saved for you to revisit at any time.
QUESTIONS?
- Email: support@ycharts.com
- Call: (866) 965-7552
READY TO GET STARTED?
Unlock My AccessAccess Edit Charts Now
Unlock access to Edit Charts by registering below. No credit card required.
Unlock My AccessQUESTIONS?
- Email: support@ycharts.com
- Call: (866) 965-7552