

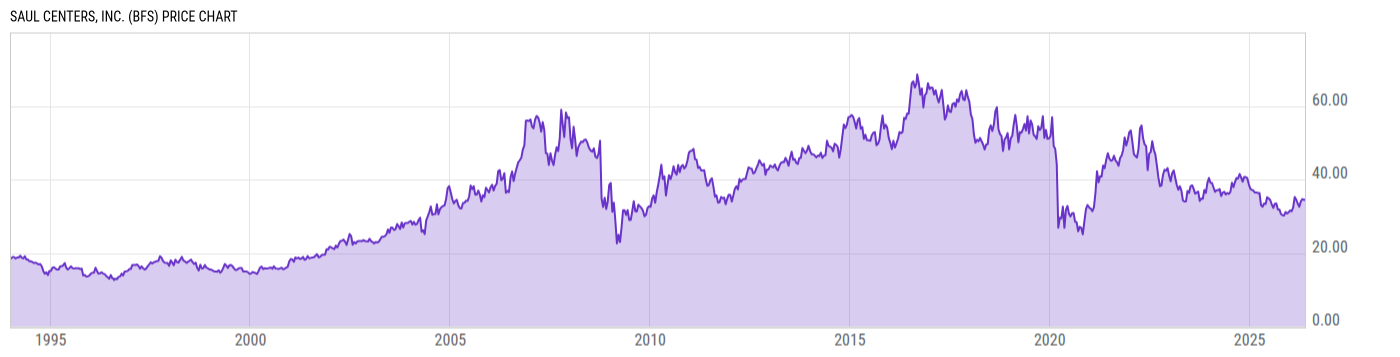
Saul Centers, Inc. (BFS)
36.51
-0.03
(-0.08%)
USD |
NYSE |
Jun 08, 16:00
36.54
+0.04
(+0.10%)
Pre-Market: 20:00
Price Chart
Key Stats
| Price and Performance | |
|---|---|
| Market Cap | 897.97M |
| 52 Week High (Daily) | |
| 52 Week Low (Daily) | |
| All-Time High (Daily) | |
| Year to Date Total Returns (Daily) | |
| 1 Month Total Returns (Daily) | |
| 1 Year Total Returns (Daily) | 14.30% |
| Valuation | |
| PE Ratio | 34.61 |
| PE Ratio (Forward) | |
| PS Ratio | 2.985 |
| Price to Book Value | 7.684 |
| EV to EBITDA | |
| Dividend | |
|---|---|
| Dividend | 0.59 |
| Dividend Yield (Forward) | |
| Financials | |
| Revenue (5 Year Growth) | |
| Revenue (Quarterly YoY Growth) | |
| EPS Diluted (5 Year Growth) | |
| EPS Diluted (Quarterly YoY Growth) | |
| Debt to Equity Ratio | 5.295 |
| Return on Equity | |
| Return on Assets | |
| Risk | |
| Beta (5Y) | |
| Max Drawdown (5Y) | 36.76% |
Profile
| Saul Centers, Inc. is a real estate investment trust, which engages in the ownership, management, and development of income producing properties. It operates through the following segments: Shopping Centers and Mixed-Use Properties. The Shopping Centers segment consists of community and neighbourhood shopping centers which are anchored by supermarkets, discount department stores, and drug stores. The Mixed-Use Properties segment consists of facilities which are located in differing commercial environments with distinctive demographic characteristics and are geographically removed from one another. The company was founded on June 10, 1993 and is headquartered in Bethesda, MD. |
| URL | http://www.saulcenters.com |
| Investor Relations URL | https://ir.saulcenters.com |
| HQ State/Province | Maryland |
| Sector | Real Estate |
| Industry | Retail REITs |
| Next Earnings Release | Aug. 06, 2026 (est.) |
| Last Earnings Release | May. 07, 2026 |
| Next Ex-Dividend Date | N/A |
| Last Ex-Dividend Date | Apr. 15, 2026 |